KubeCon North America 2021 – Breakout Session Recap
I gave a breakout session at this year’s KubeCon North America titled “Stream vs. Batch: Leveraging M3 and Thanos for Real-Time Aggregation.” This blog is a recap of the topics and concepts discussed during the session. Visit our KubeCon North America events page for the full session recording.
Why aggregation matters for real-time
With monitoring workflows aimed at minimizing time to detect incidents, having real-time insights is critical for maintaining reliable cloud-native applications. But monitoring business-critical applications can become difficult at scale. How do you continue processing large volumes of real time data while maintaining valuable insights? This is where aggregation can help!
From our partners:
Taking the example given during the presentation, when querying a high cardinality metric such as CPU usage, query time can take up to 20 seconds to complete as it’s fetching 60,000 time series across all pods and labels.
In most metrics monitoring use cases, however, you don’t need the view metrics at the per pod or label level, and an aggregate view is sufficient for understanding how your system is performing at a high level. Continuing with the above example, if you aggregate on only two labels (e.g. container name and namespace) by pre-computing the sum at one minute intervals, the query results become real-time (0.4 seconds) with roughly 200 time series.
Stream vs. batch aggregation
Understanding the value of aggregation for query performance and real-time results, it’s also important to know the two primary approaches to metrics aggregation – stream and batch.
- With stream aggregation, metrics data is streaming continuously, and the aggregation is done in memory on the streaming ingest path before writing results to a time series database (TSDB). Because data is aggregated in real-time, streaming aggregation is typically meant for information that’s needed immediately.

- With batch aggregation, data gets collected over time, and aggregation is done by reading raw metrics from a TSDB before writing back the aggregated metric data. Because data is aggregated in batches over time, batch aggregation is typically meant for large quantities of information that aren’t time sensitive.

Aggregation with M3 and Thanos
M3 and Thanos each have their own approaches to stream and batch aggregation, both of which are based on how Prometheus performs aggregation via recording rules. Prometheus recording rules allow for pre-computing of frequently needed and/or expensive queries before then storing back the aggregate metrics to a TSDB. They execute and pre-compute as a single process in memory at regular intervals making them especially useful for dashboards. With large scale metrics monitoring, however, you will typically outgrow a single Prometheus instance and turn to a Prometheus remote storage solution like M3, Thanos, and Cortex.
Stream aggregation with M3
M3 is an open source metrics engine comprised of four main components:
- M3DB – distributed, custom built TSDB
- M3 Coordinator – optimized ingest and downsampling tier
- M3 Aggregator – streaming aggregation tier (optional, depends on use case)
- M3 Query – distributed query engine
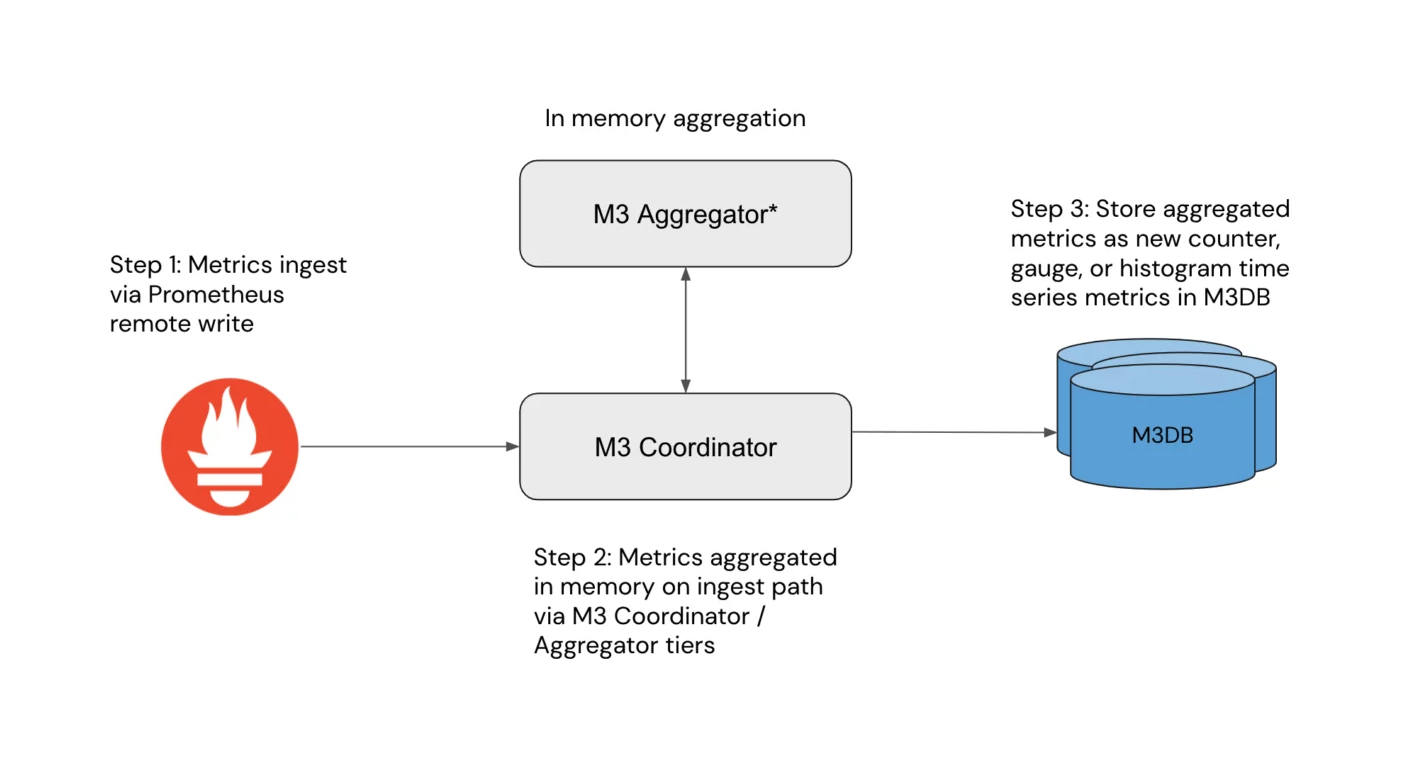
M3’s approach to aggregation uses roll-up rules, which aggregate across multiple time series at regular intervals using the M3 coordinator and, in some use cases, the M3 aggregator. Before writing the newly aggregated series to M3DB, the M3 coordinator will reconstitute the series as a counter, histogram, or gauge metric — all of which are compatible with PromQL (check out our blog on the primary types of Prometheus metrics for more information). With aggregation done in-memory upon the ingest path, the aggregated metrics are immediately available for query with M3.

Batch Aggregation with Thanos
Similar to M3, Thanos is an open source metrics monitoring solution. It has several main components, including:
- Store / Store API – gateway to object store
- Querier – horizontally scalable and stateless query, aggregation, and deduplication tier
- Sidecar – proxy for Prometheus via remote write/read
- Compactor – downsampling and block compaction tier
- Ruler – evaluates Prometheus recording and alerting rules
With the Thanos sidecar setup, Prometheus metrics are scraped and stored inside each Prometheus instance. From there, the Thanos query tier pulls data from the instances via the sidecars before aggregating and deduplicating the metrics. Once these metrics have been processed inside the querier, the query results are available for display inside your dashboards (e.g. Grafana). However, for larger scale queries, especially those needed on a regular basis, the querier can be informed by the ruler to execute Prometheus recording rules on the collected metrics. Once the rules have been evaluated, the ruler will send the newly aggregated time series to Thanos object store (e.g. S3) for query and/or longer term storage.

How to choose: pros and cons of each approach
Let’s now take a look at the various benefits and tradeoffs of these two approaches – streaming with M3 and batch with Thanos – and how they compare to one another:
M3 Pros: With M3, metrics are aggregated in-memory on the ingest path making them immediately available for query. Additionally, with roll up rules, only the aggregated metrics need to be persisted to M3DB and all other raw data can be dropped. By alleviating the query requirements for M3DB, you are able to scale to a higher number of alerts and recording rules.
M3 Cons: In terms of trade offs, M3 aggregation is more complex to operate and deploy compared to Thanos. It also does not support arbitrary PromQL, but instead reconstitutes the aggregate metrics as counters, histograms, and gauges.
Thanos Pros: Compared to M3, Thanos is more simple to operate, especially when scaling resources up or down. It is also fully PromQL compatible allowing for arbitrary PromQL queries and aggregation via Prometheus recording rules.
Thanos Cons: In terms of trade offs, Thanos aggregation adds an additional step when compared to streaming aggregation, as you need to re-query, read, and then write metrics to storage over the network. This can lead to large resource consumption, as well as slow queries. With aggregation performed against the query tier, larger scale queries may also take a while to request metrics from each Prometheus instance, and in some cases, will lead to skipped metrics by missing the intervals set by recording rules.
That’s a wrap!
Focusing on M3 and Thanos, we’re able to compare some of the major benefits and tradeoffs of using stream and batch processing for large scale metrics monitoring. If interested in learning more, check out the full session recording or visit M3 and Thanos documentation.
Chronosphere is the only observability platform that puts you back in control by taming rampant data growth and cloud-native complexity, delivering increased business confidence. To learn more, visit https://chronosphere.io/ or request a demo.
Guest post originally published on Chronosphere’s blog by Gibbs Cullens
Source CNCF
For enquiries, product placements, sponsorships, and collaborations, connect with us at [email protected]. We'd love to hear from you!
Our humans need coffee too! Your support is highly appreciated, thank you!