Image the following. It’s 9.00. You just finished the daily stand-up. Time to get into deep focus mode and build that next feature. Or perhaps Huddle with your backend buddy and get some positive energy by getting praise for yesterday’s code. Are dashboards really on top of your mind then?
But suddenly … something happens. You read yesterday that a 3rd party had an outage. Or perhaps that a web browser made a suboptimal rollout. You try hard to focus, but you can’t help thinking:
From our partners:
Are my users happy?
Or are they affected by a freak event and customer service is about to ruin your day?
In this blog post, we discuss how you can prove to yourself that your users are happy thanks to application-specific dashboards built on top of Grafana and Prometheus. In the end, I hope to inspire Product Managers to learn more about Grafana and how adding a few lines of code tremendously increased transparency across departments and accelerated delivering value to the customers – with a rather small effort.
Why measure?
The faster you drive, the more carefully you need to look. This applies also to software development: Development velocity is not only a matter of “typing faster,” it’s also about measuring the impact of your keystroke.
There are two “mantras” on why measuring – or monitoring as it’s often called – is important:
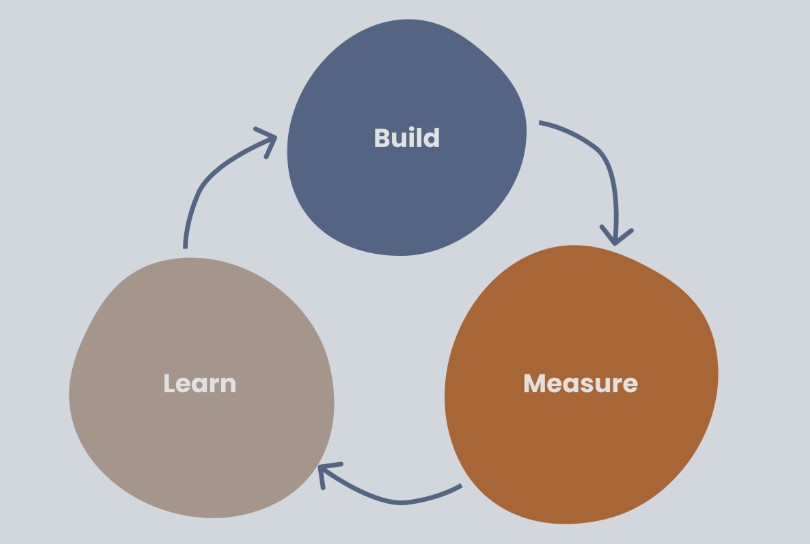
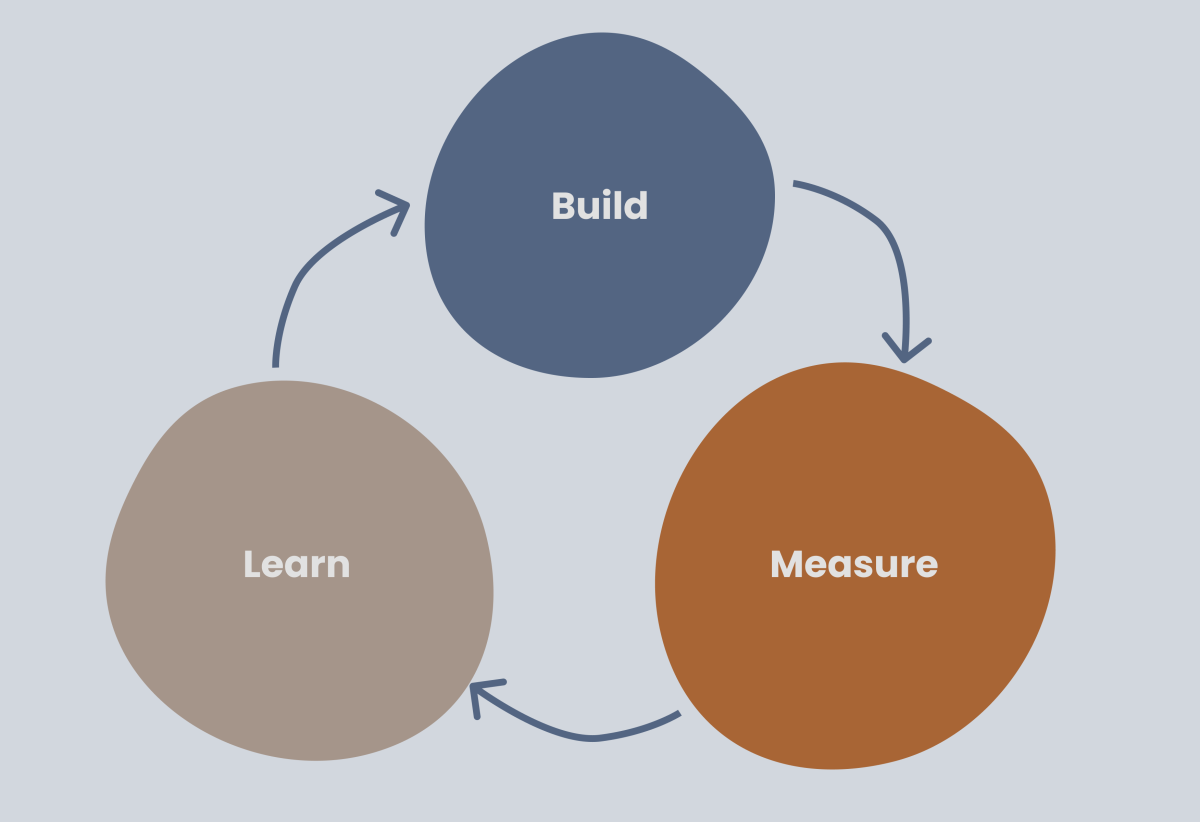
- Build the right thing: As a product manager, you really want to know how the newly released feature is used, learn from that and decide what feature to build next. While customer interviews are an essential ingredient, this can be complemented – dare I say cross-checked – by measuring actual production usage. As the lean thinking motto goes: build, measure, learn.
- Build the thing right: As a software engineer, you really want to know if you introduced a bug. Perhaps your code works 99% of the time, except with some weird end-user device or rare data – say an Excel file with 1904 date system. In fact, the “DevOps loop” puts great emphasis on monitoring how the application performs in production before planning next steps. Importantly, “monitoring” is not an excuse for poor testing. Rather it’s the inevitability of some testing needing to happen with real users on production data.
Several concepts within the umbrella term observability are available:
- Metrics are labelled time series values, such as “at 9.18 there were 5 active users”.
- Logs are lines of text describing an application event, such as “user Jane logged in”.
- Traces are very detailed
Why metrics?
When compared to logs and traces, metrics have – IMHO – the highest “insight to overhead” ratio. Specifically:
- Metrics bring a lot of value at a glance – just overlap the hourly number of active users from now with the same information 7 days ago and you can already get situational awareness.
- Metrics are easy to add to your application. Check out the .NET and NodeJS examples to see how to use the Prometheus client library.
- Metrics collection and storage is rather low overhead – I mean, at the end of the day, these are simply numbers.
- Metrics are easy to analyse over multiple years – say for comparing year-over-year data-per-user stored of your application.
- Bonus: Metrics do not pose a risk to data protection. Indeed, it’s too easy to slip personal data into logs and traces, making retention a difficult balancing act. In contrast, while theoretically not impossible, you really need to try hard to slip personal data into metrics.
In fact, many organisations are displaying metrics dashboards on screens around their offices to give good situational awareness, and avoid “unknown unknowns.” And if you work remotely, what better excuse to purchase that second – or third – screen.
How to get started with metrics?
To get started with metrics, there is a mature ecosystem around them. Prometheus server can be used for metrics collection, while Grafana can be used to create beautiful dashboards for visualisation. If you want to store metrics over years, Thanos can be added to the mix. If your application is containerized and runs in Kubernetes, many Kubernetes distributions already bundle these tools.
I’d suggest reading up on: metric types and PromQL. This will help you build a solid vocabulary around metrics and inspire you to their full potential. Soon you will realise that technology is the “easy” part: The hard part is figuring out what metrics you need.
What metrics do I need?
Metrics should answer three questions: Are my users happy? Are my applications happy? Are my servers happy? Prometheus server – specifically its most common Kubernetes packaging, the Prometheus Operator – and Prometheus clients come with a lot of metrics built-in to answer the last two questions. For example, the Prometheus client for .NET collects response times and error rates for each HTTP endpoint of your application.
All you have to think about is adding the right metrics to your application.
But really, are my users happy?
Challenge yourself to come up with metrics that make sense only to your application. Do the “Cristian specificity test”: pick a metric for your application, then see if it makes sense to another application. For example, say you work on a healthcare app and assess whether to add “number of SQL queries”. Does this metric make sense for a food delivery app? Yup! Then it’s not a very good metric to answer if your users are happy? However, this is a really good “is my application happy” metric.
Let us take another example: “number of doctor appointments cancelled”. Makes a lot of sense for a healthcare app. Makes zero sense for a food delivery app.
Let me illustrate another way to come up with an “are my users happy” metric. Take the sales brochure or online documentation of your app, and convert the fact sheet into metrics. Ideally, you want to come up with a metric that people in the sales department can understand. Bonus, make them say “I actually had customers asking about this.”
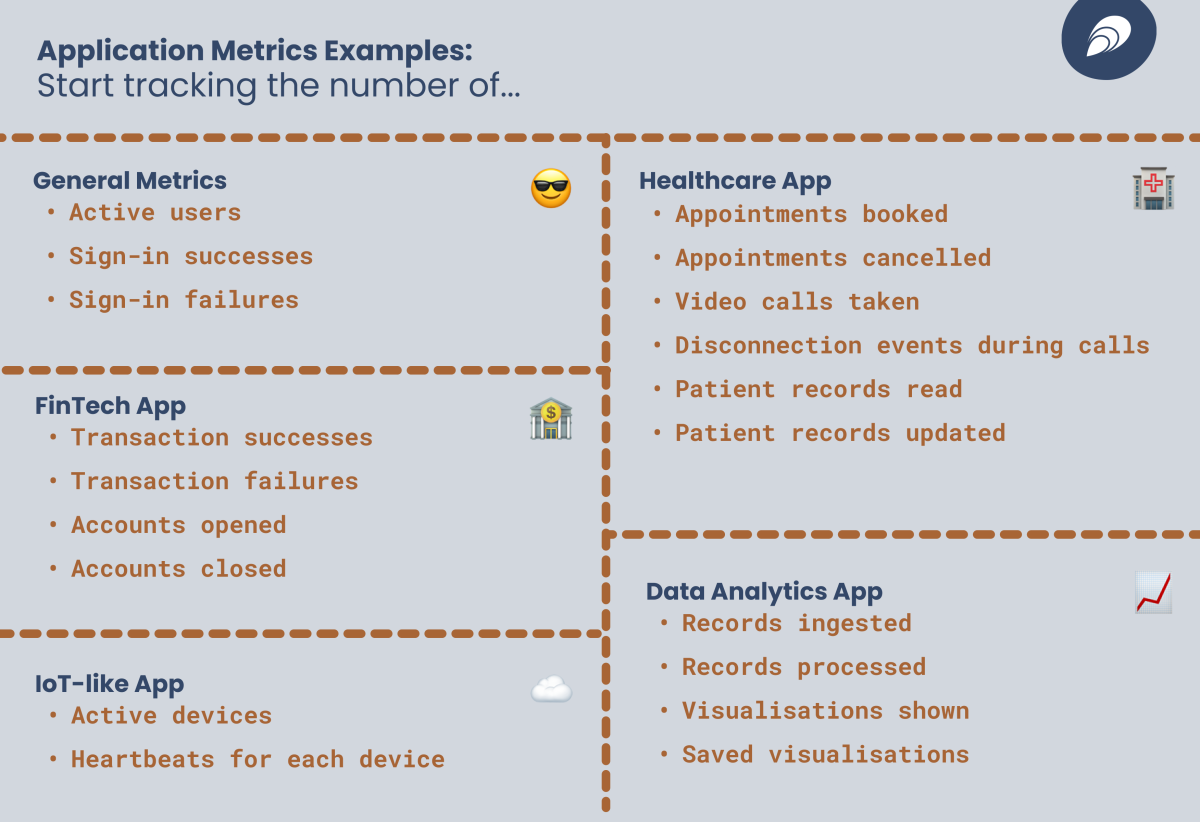
Here is a list of metrics to draw inspiration from:
- General metrics:
- Number of active users
- Number of sign-in successes
- Number of sign-in failures
- Healthcare app:
- Number of appointments booked
- Number of appointments cancelled
- Number of video calls taken
- Frame drops, audio drops, disconnection events during calls
- Number of patient records read
- Number of patient records updated
- FinTech app:
- Number of transactions successes
- Number of transactions failures
- Number of accounts opened
- Number of accounts closed
- IoT-like app:
- Number of active devices
- Number of heartbeats for each device
- Data analytics applications
- Records ingested
- Records processed
- Visualisations shown
- Number of saved visualisations
Steady, set, go!
Now that you read this post, go ahead: add your first metrics and create your first “are my users happy” dashboard. Show it to your product manager and see their reaction.
Let me end this post with a beautiful story.
I once worked for a customer who had a 16-page spec for a “supervision software project”. The software was supposed to monitor the actual core software and allow account managers and first-line support to perform basic diagnostics on how the software was performing for their accounts.
Unfortunately, the spec gathered dust and was unattended for over 2 years. There was simply never enough time to implement them.
Then I showed product managers the power of Grafana and engineers the few lines of code they needed to add to export variables – that they already had in their code – to metrics. It felt like overnight their supervision software was implemented, tremendously opening up collaboration within various departments and accelerating value delivery to their customers, at a fraction of the cost.
Guest post originally published on the Elastisys blog
Source CNCF
For enquiries, product placements, sponsorships, and collaborations, connect with us at [email protected]. We'd love to hear from you!
Our humans need coffee too! Your support is highly appreciated, thank you!