Network logs serve a critical purpose in Google Cloud by helping users troubleshoot, manage, and optimize their networks. Cloud Logging provides a logging pipeline to reliably ingest network logs like VPC Flow Logs at scale and tools to quickly find and analyze network logs. Since Log Analytics launched as Generally Available (GA) in January, network admins now have entirely new capabilities to search and aggregate network logs to easily gain insights into network trends, discover anomalies, and troubleshoot potential networking issues. Since the cost for Log Analytics is included in the Cloud Logging ingestion cost, you can now get more insight and value out of your network logs without the additional cost.
From logs to insights
VPC Flow Logs provide detailed information to help troubleshoot, monitor, and optimize your network. Log entries contain round trip time latency (TCP), packet count and byte count along with the metadata describing the source and destination. Any logging solution used to observe your network, perform forensics, monitor real-time security, and optimize networking expenses needs to be able to process logs at scale, centralize logs, and provide rich tools to analyze the log data. Cloud Logging helps in several important ways:
From our partners:
- Aggregate logs with centralized log storage – Centralize logs with the Logs Router, which provides a secure, compliant, scalable, and reliable log routing platform.
- Ad hoc log analysis – Analyze network performance using Log Analytics for ad-hoc, query-time log analysis over time as a part of network troubleshooting. In this case, metrics often don’t work well due to the high cardinality values in network logs.
- Aggregated network log insights – Gain insights into the top network traffic, top egress/ingress traffic with dashboards with data from Log Analytics to help best manage your network over time. Using aggregation, users can create top-level dashboards and then drill down via ad hoc reporting when necessary.
In this blog post, we’ll cover a few examples of how to analyze your network logs with Log Analytics in Cloud Logging. If you haven’t yet already, upgrade your log buckets to use Log Analytics.
Example 1: Analyze network egress by destination country
Understanding network egress by region can help to surface unexpected network traffic. VPC Flow logs capture the necessary traffic and metadata that can be used to track the egress bytes, packets and latency by region. This may be useful in identifying differences in tracking unexpected changes that may signal a traffic failure or a security event. With Log Analytics, you can easily aggregate data by country and use ad hoc queries to drill down to the underlying details to investigate further.
The following query tracks all external traffic by country served from virtual machines. Each VPC flow log includes a reporter field which denotes whether the log is written by the source or destination. The dest_location field provides the available geographic location of the log if it was external to the network.
SELECT
JSON_VALUE(json_payload.dest_location.country) as country,
SUM(CAST(JSON_VALUE(json_payload.bytes_sent) as INT64)) as total_bytes_sent,
SUM(CAST(JSON_VALUE(json_payload.packets_sent) as INT64)) as total_packets_sent,
AVG(CAST(JSON_VALUE(json_payload.rtt_msec) as INT64)) as avg_rtt_msec
FROM
`[MY_PROJECT].global._Default._Default`
WHERE
log_id = "compute.googleapis.com/vpc_flows"
AND timestamp(replace(substr(JSON_VALUE(json_payload.start_time),0,19),"T"," ")) > TIMESTAMP_SUB(CURRENT_TIMESTAMP(), INTERVAL 1 HOUR)
AND JSON_VALUE(json_payload.reporter) = "SRC"
AND JSON_VALUE(json_payload.dest_location.country) is not null
GROUP BY 1
ORDER BY 2 DESC
See the query in our sample github repo.
To use the queries shown in this document on the Log Analytics page, replace the contents of the FROM clause with the name of the table that corresponds to the view that you want to query. The table name has the format project_ID.region.bucket_ID.view_ID. You can find the table name for a view on the Log Analytics page; the default query for a log view lists the table name in the FROM statement. For information about how to access the default query, see Query a log view.
Log Analytics has a built-in charting capability that’s currently available in Preview. Running this query in a demo project, provides interesting insights into the source patterns for the traffic.
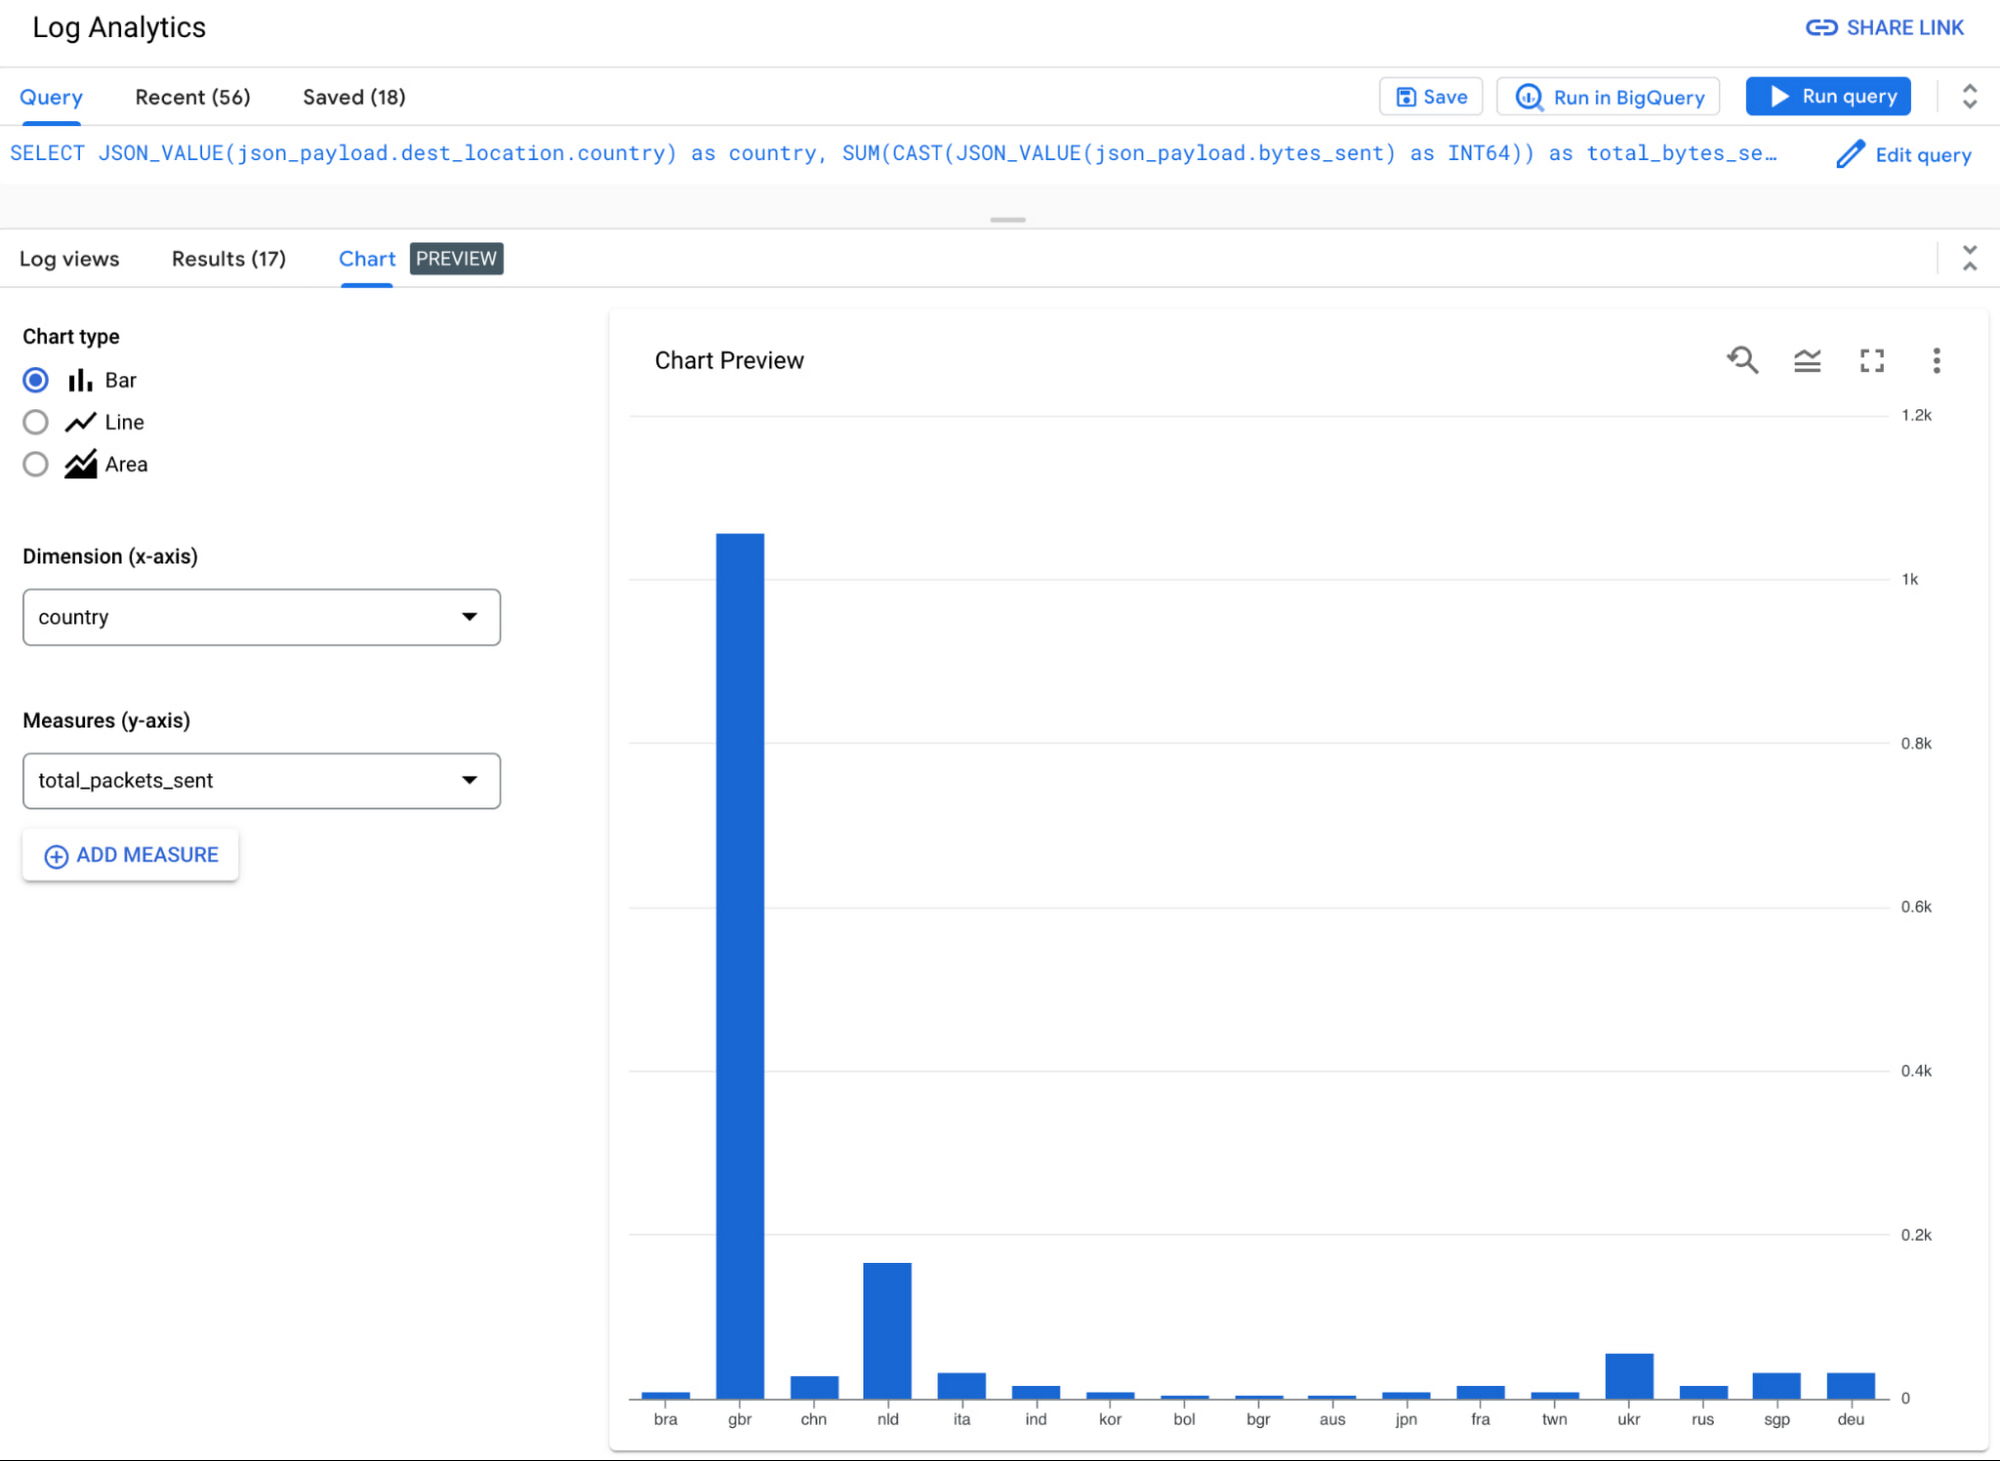
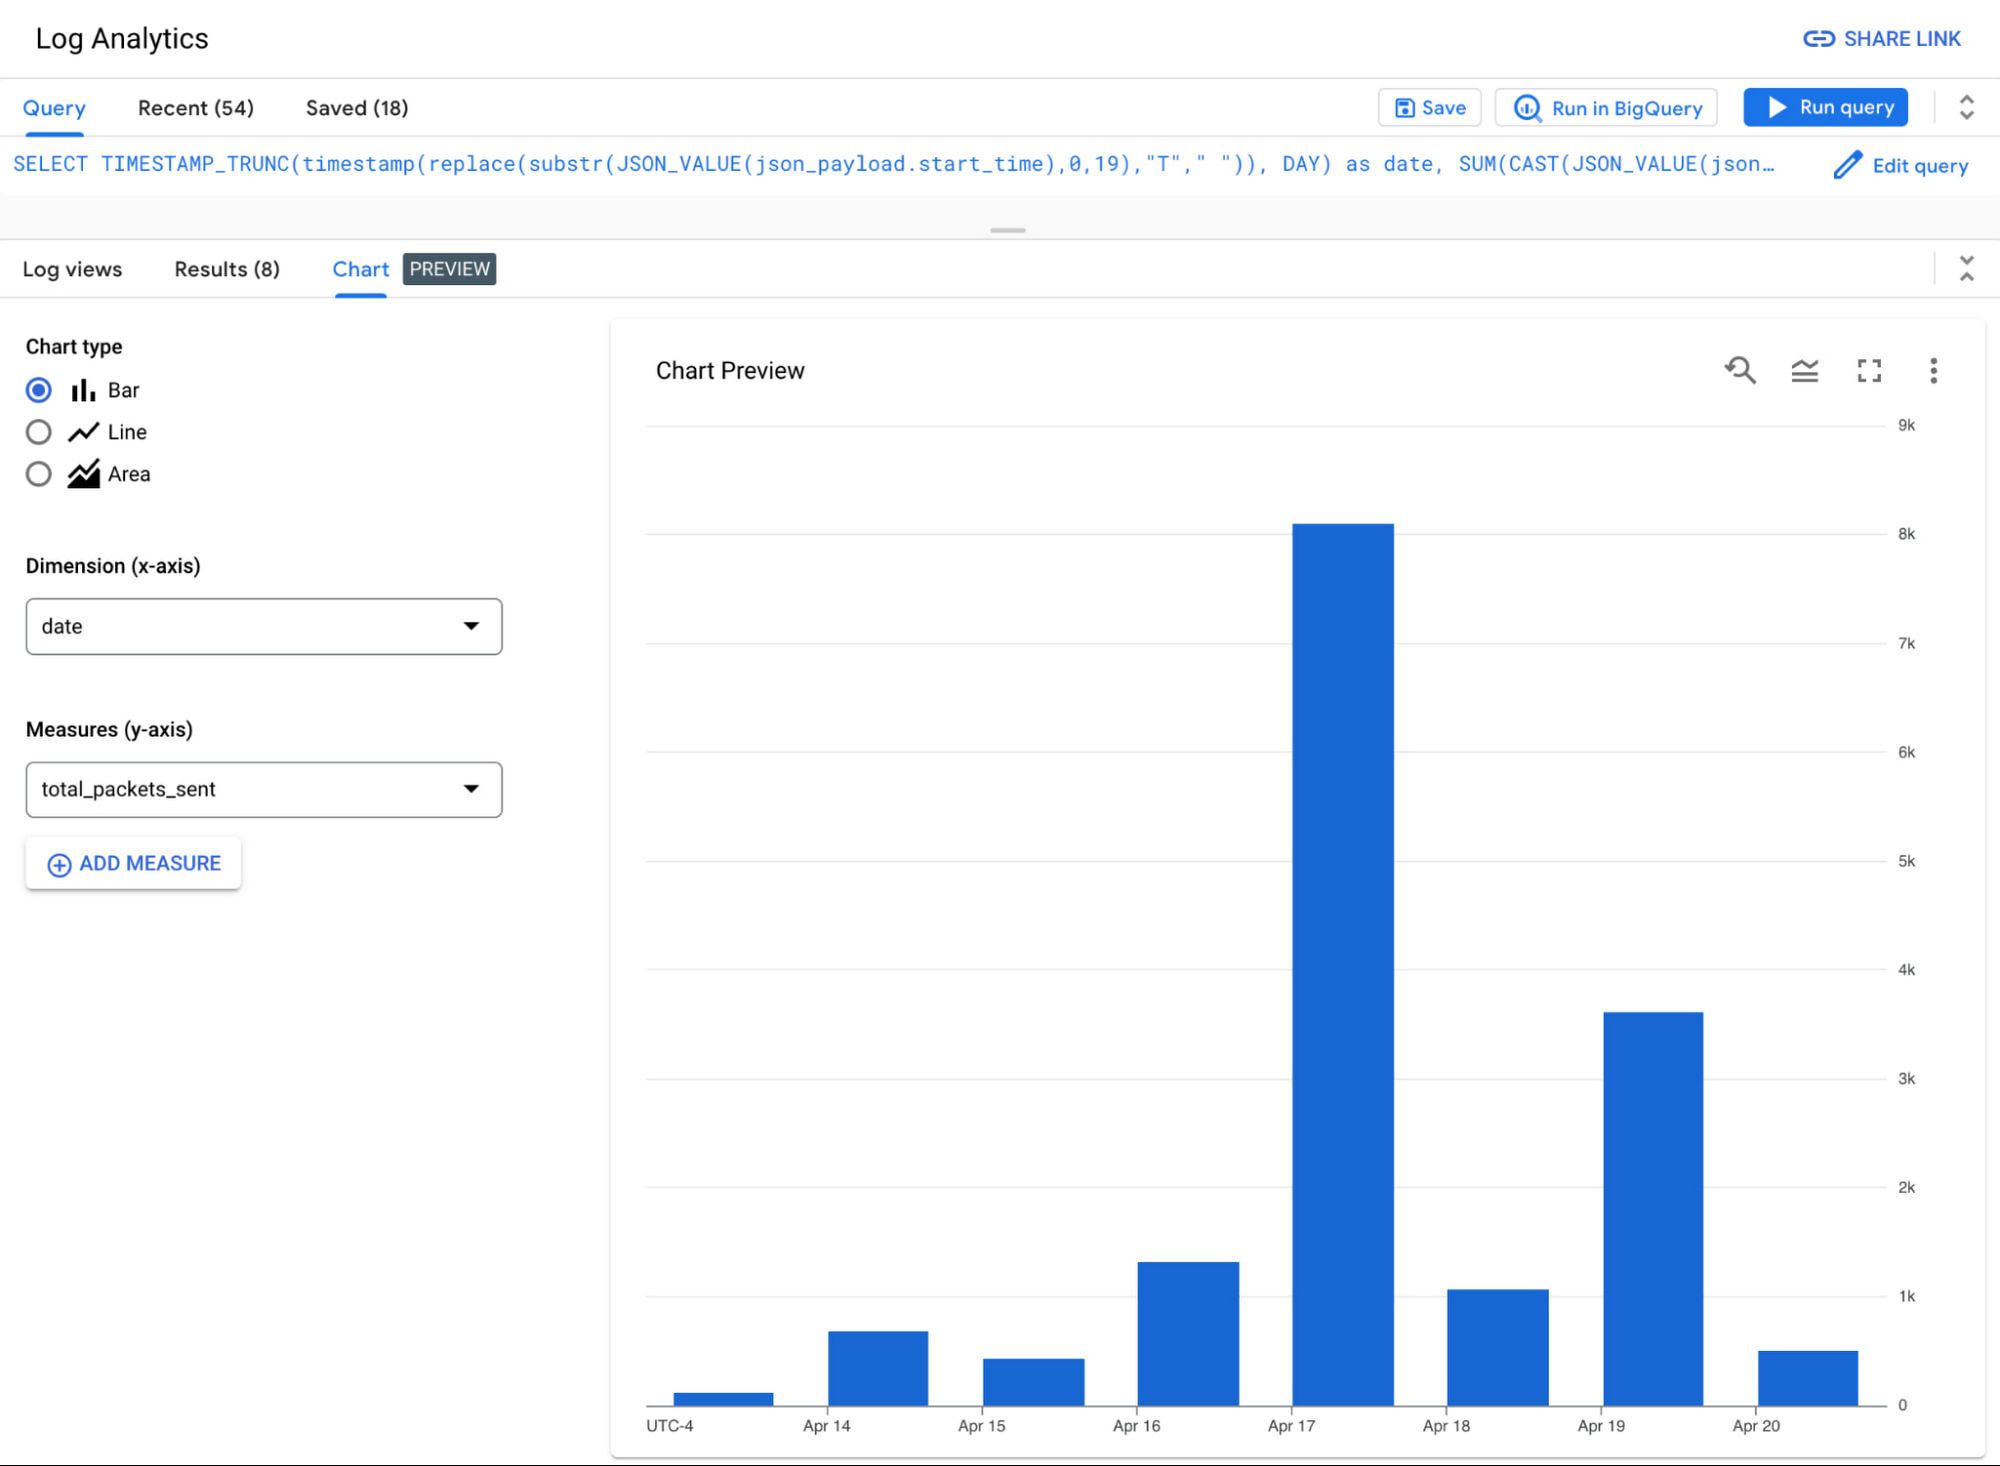
To better understand traffic egressing to a specific country, it might be interesting to also analyze the bytes and packets sent over the past week for one specific country code (“gbr”). For example:
SELECT TIMESTAMP_TRUNC(timestamp(replace(substr(JSON_VALUE(json_payload.start_time),0,19),"T"," ")), DAY) as date,
SUM(CAST(JSON_VALUE(json_payload.bytes_sent) as INT64)) as total_bytes_sent,
SUM(CAST(JSON_VALUE(json_payload.packets_sent) as INT64)) as total_packets_sent,
AVG(CAST(JSON_VALUE(json_payload.rtt_msec) as INT64)) as avg_rtt_msec
FROM
`[MY_PROJECT].global._Default._Default`
WHERE
log_id = "compute.googleapis.com/vpc_flows"
AND timestamp(replace(substr(JSON_VALUE(json_payload.start_time),0,19),"T"," ")) > TIMESTAMP_SUB(CURRENT_TIMESTAMP(), INTERVAL 7 DAY)
AND JSON_VALUE(json_payload.reporter) = "SRC"
AND JSON_VALUE(json_payload.dest_location.country) = "gbr"
GROUP BY 1
ORDER BY 1 ASC
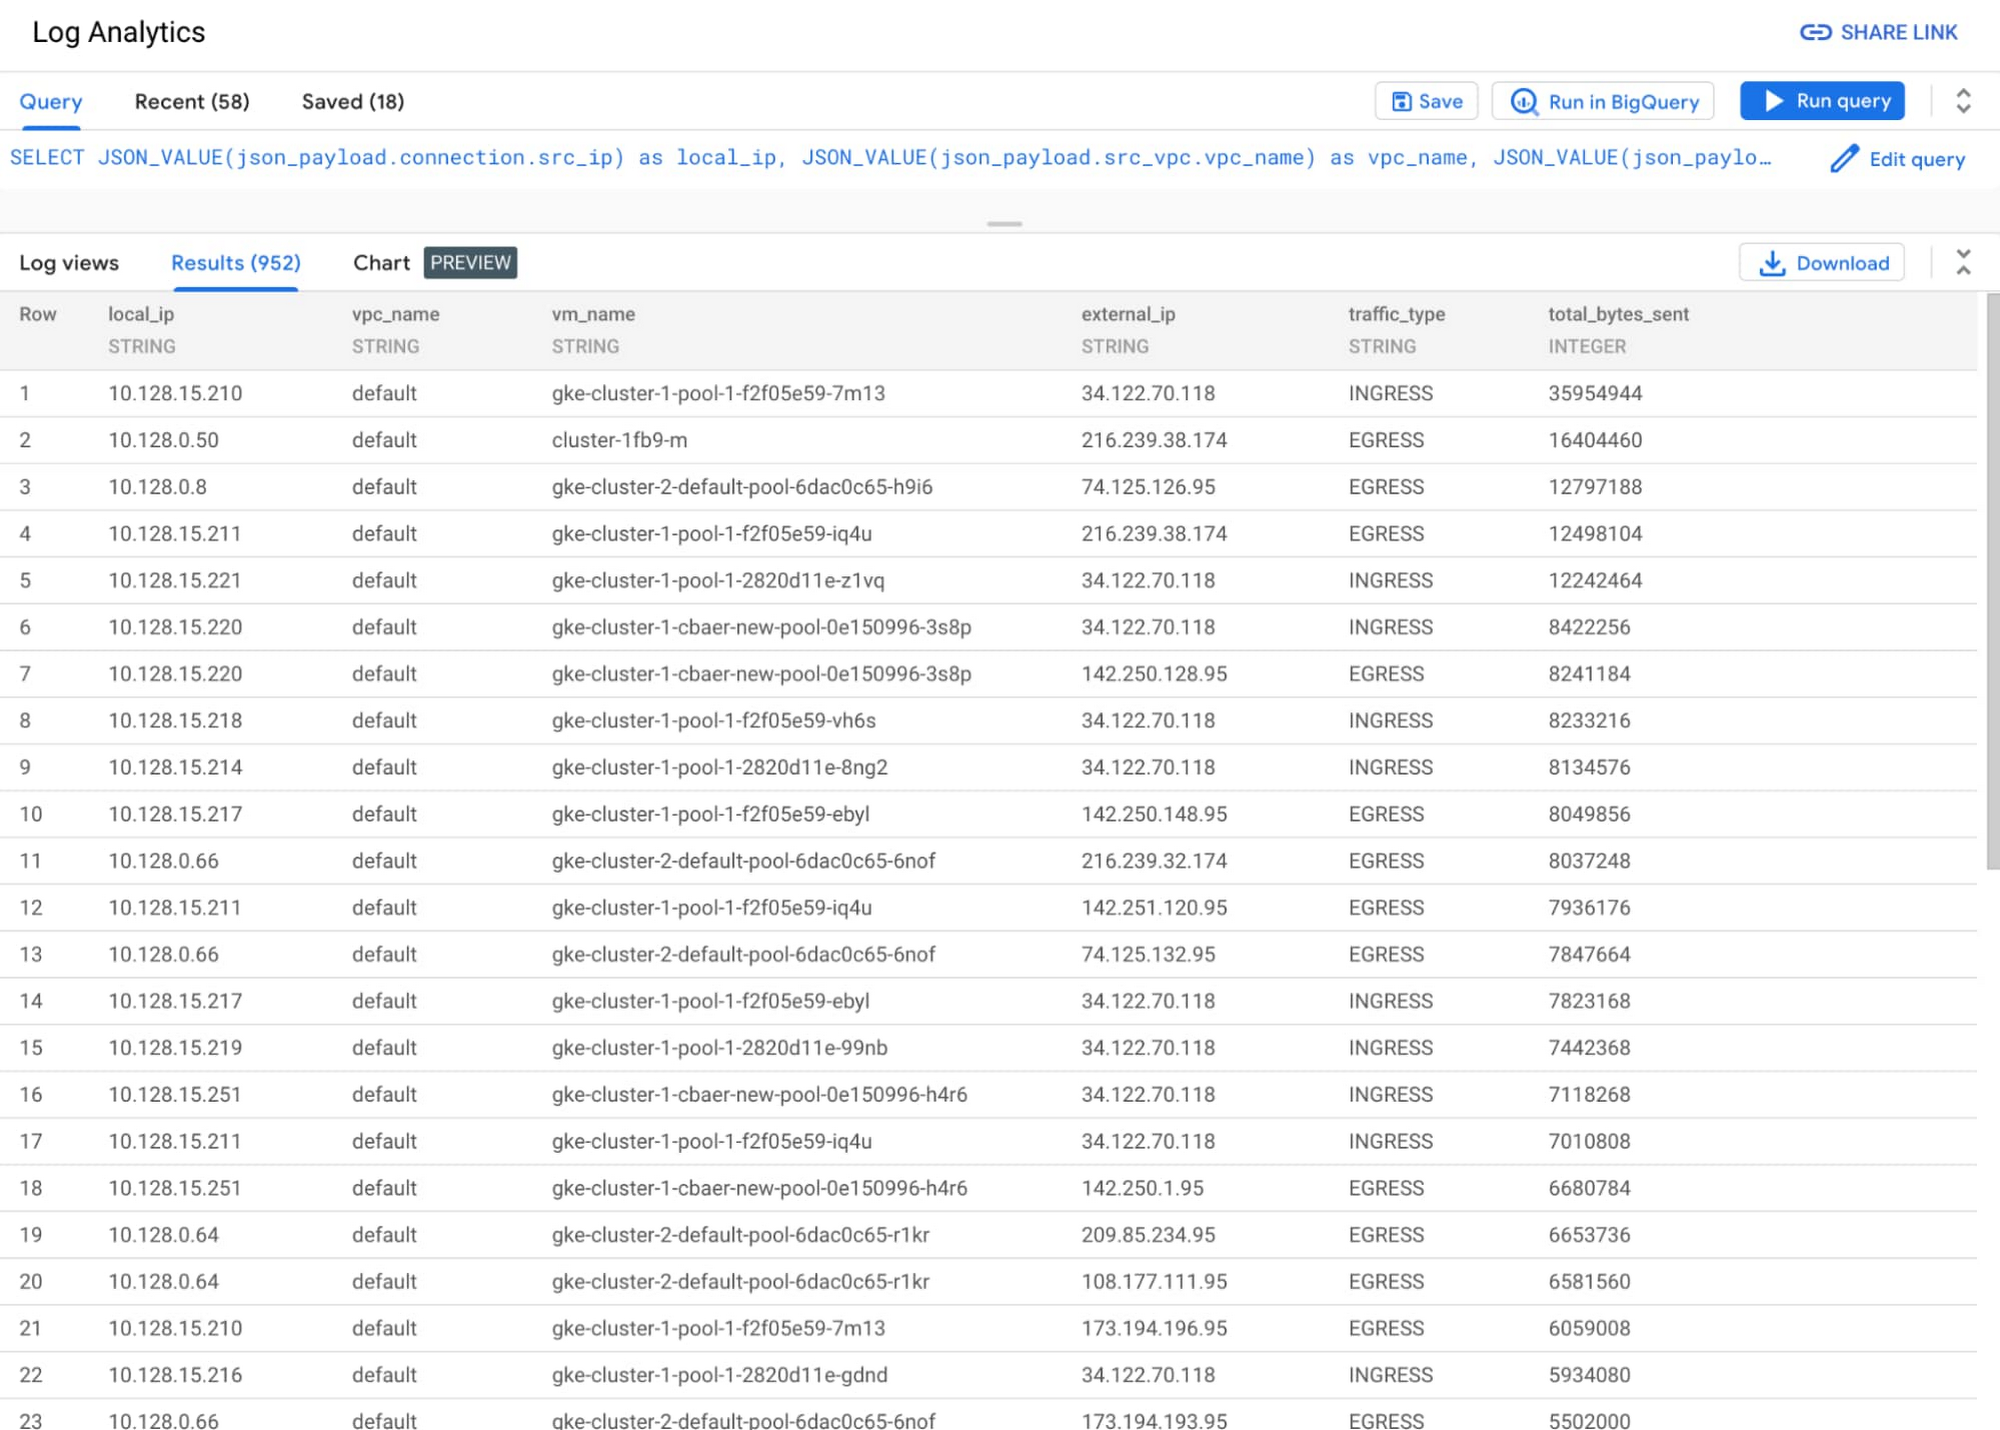
Example 2: Total external traffic by IP
Understanding traffic by IP address enables you to analyze unexpected traffic and troubleshoot potential network issues. Log Analytics helps streamline this workflow by enabling aggregation of network traffic by high cardinality fields, such as IP addresses.
In the following query, we join two distinct queries to centralize the source and destination logs into a single results table. It contains not only internet traffic, but also traffic to Google services and other projects. Using the query, it’s easy to quickly identify the virtual machines with the most ingress and egress traffic.
SELECT
JSON_VALUE(json_payload.connection.src_ip) as local_ip,
JSON_VALUE(json_payload.src_vpc.vpc_name) as vpc_name,
JSON_VALUE(json_payload.src_instance.vm_name) as vm_name,
JSON_VALUE(json_payload.connection.dest_ip) as external_ip,
"EGRESS" as traffic_type,
SUM(CAST(JSON_VALUE(json_payload.bytes_sent) as INT64)) as total_bytes_sent
FROM
`[MY_PROJECT].global._Default._Default`
WHERE
log_id = "compute.googleapis.com/vpc_flows"
AND timestamp(replace(substr(JSON_VALUE(json_payload.start_time),0,19),"T"," ")) > TIMESTAMP_SUB(CURRENT_TIMESTAMP(), INTERVAL 1 HOUR)
AND JSON_VALUE(json_payload.reporter) = "SRC"
GROUP BY 1,2,3,4
UNION ALL
SELECT
JSON_VALUE(json_payload.connection.dest_ip) as local_ip,
JSON_VALUE(json_payload.dest_vpc.vpc_name) as vpc_name,
JSON_VALUE(json_payload.dest_instance.vm_name) as vm_name,
JSON_VALUE(json_payload.connection.src_ip) as external_ip,
"INGRESS" as traffic_type,
SUM(CAST(JSON_VALUE(json_payload.bytes_sent) as INT64)) as total_bytes_sent
FROM
`[MY_PROJECT].global._Default._Default`
WHERE
log_id = "compute.googleapis.com/vpc_flows"
AND timestamp(replace(substr(JSON_VALUE(json_payload.start_time),0,19),"T"," ")) > TIMESTAMP_SUB(CURRENT_TIMESTAMP(), INTERVAL 1 HOUR)
AND JSON_VALUE(json_payload.reporter) = "DEST"
GROUP BY 1,2,3,4
ORDER BY 6 DESC
See the query in our sample github repo.
Example 3: “Top Talkers” VM instances sending the most traffic
The top talkers network report can be useful because it allows you to identify the hosts on a network that are consuming the most bandwidth. This information can be used to optimize network performance, troubleshoot network problems, and identify security threats.
For example, if a particular host is consuming a large amount of bandwidth, you can investigate to see if the host is infected with malware or if it is being used for unauthorized activities. Another common use case is to prioritize network traffic and ensure that critical applications have the bandwidth they need.
The top talkers network report can also be used to identify trends in network usage. For example, if the amount of bandwidth consumed by a particular application is increasing, you can investigate to see if the application is being used more frequently or if it is consuming more bandwidth per user. This information can be used to plan for future network capacity needs.
SELECT
JSON_VALUE(json_payload.src_instance.vm_name) vm_name,
SUM(CAST(JSON_VALUE(json_payload.bytes_sent) as INT64)) as total_bytes_sent,
SUM(CAST(JSON_VALUE(json_payload.packets_sent) as INT64)) as total_packets_sent,
FROM
`{projectId}.global._Default._Default`
WHERE
log_id = "compute.googleapis.com/vpc_flows"
AND timestamp(replace(substr(JSON_VALUE(json_payload.start_time),0,19),"T"," ")) > TIMESTAMP_SUB(CURRENT_TIMESTAMP(), INTERVAL 1 HOUR)
AND JSON_VALUE(json_payload.reporter) = "SRC"
GROUP BY 1
ORDER BY 2 DESC
LIMIT 20
See the query in our sample github repo.
Network log trends over time
By analyzing network logs over time, you can better identify trends and gain insights. Scheduling reports and sharing insights via email helps ensure your team is receiving insights when — and where — they need them.
The Cloud Logging product team is currently working on designing and building embedded charting and dashboarding options for Log Analytics (Preview sign-up here), which we’ll cover in a future blog post. Analytical tools like Looker and Looker Studio provide excellent analytical capabilities, including charting and dashboarding. One of the key features of Log Analytics is that you can use log data in any of the tools available in the BigQuery ecosystem through the use of the linked dataset. You can visualize the same networking queries using Looker and Looker Studio dashboards.
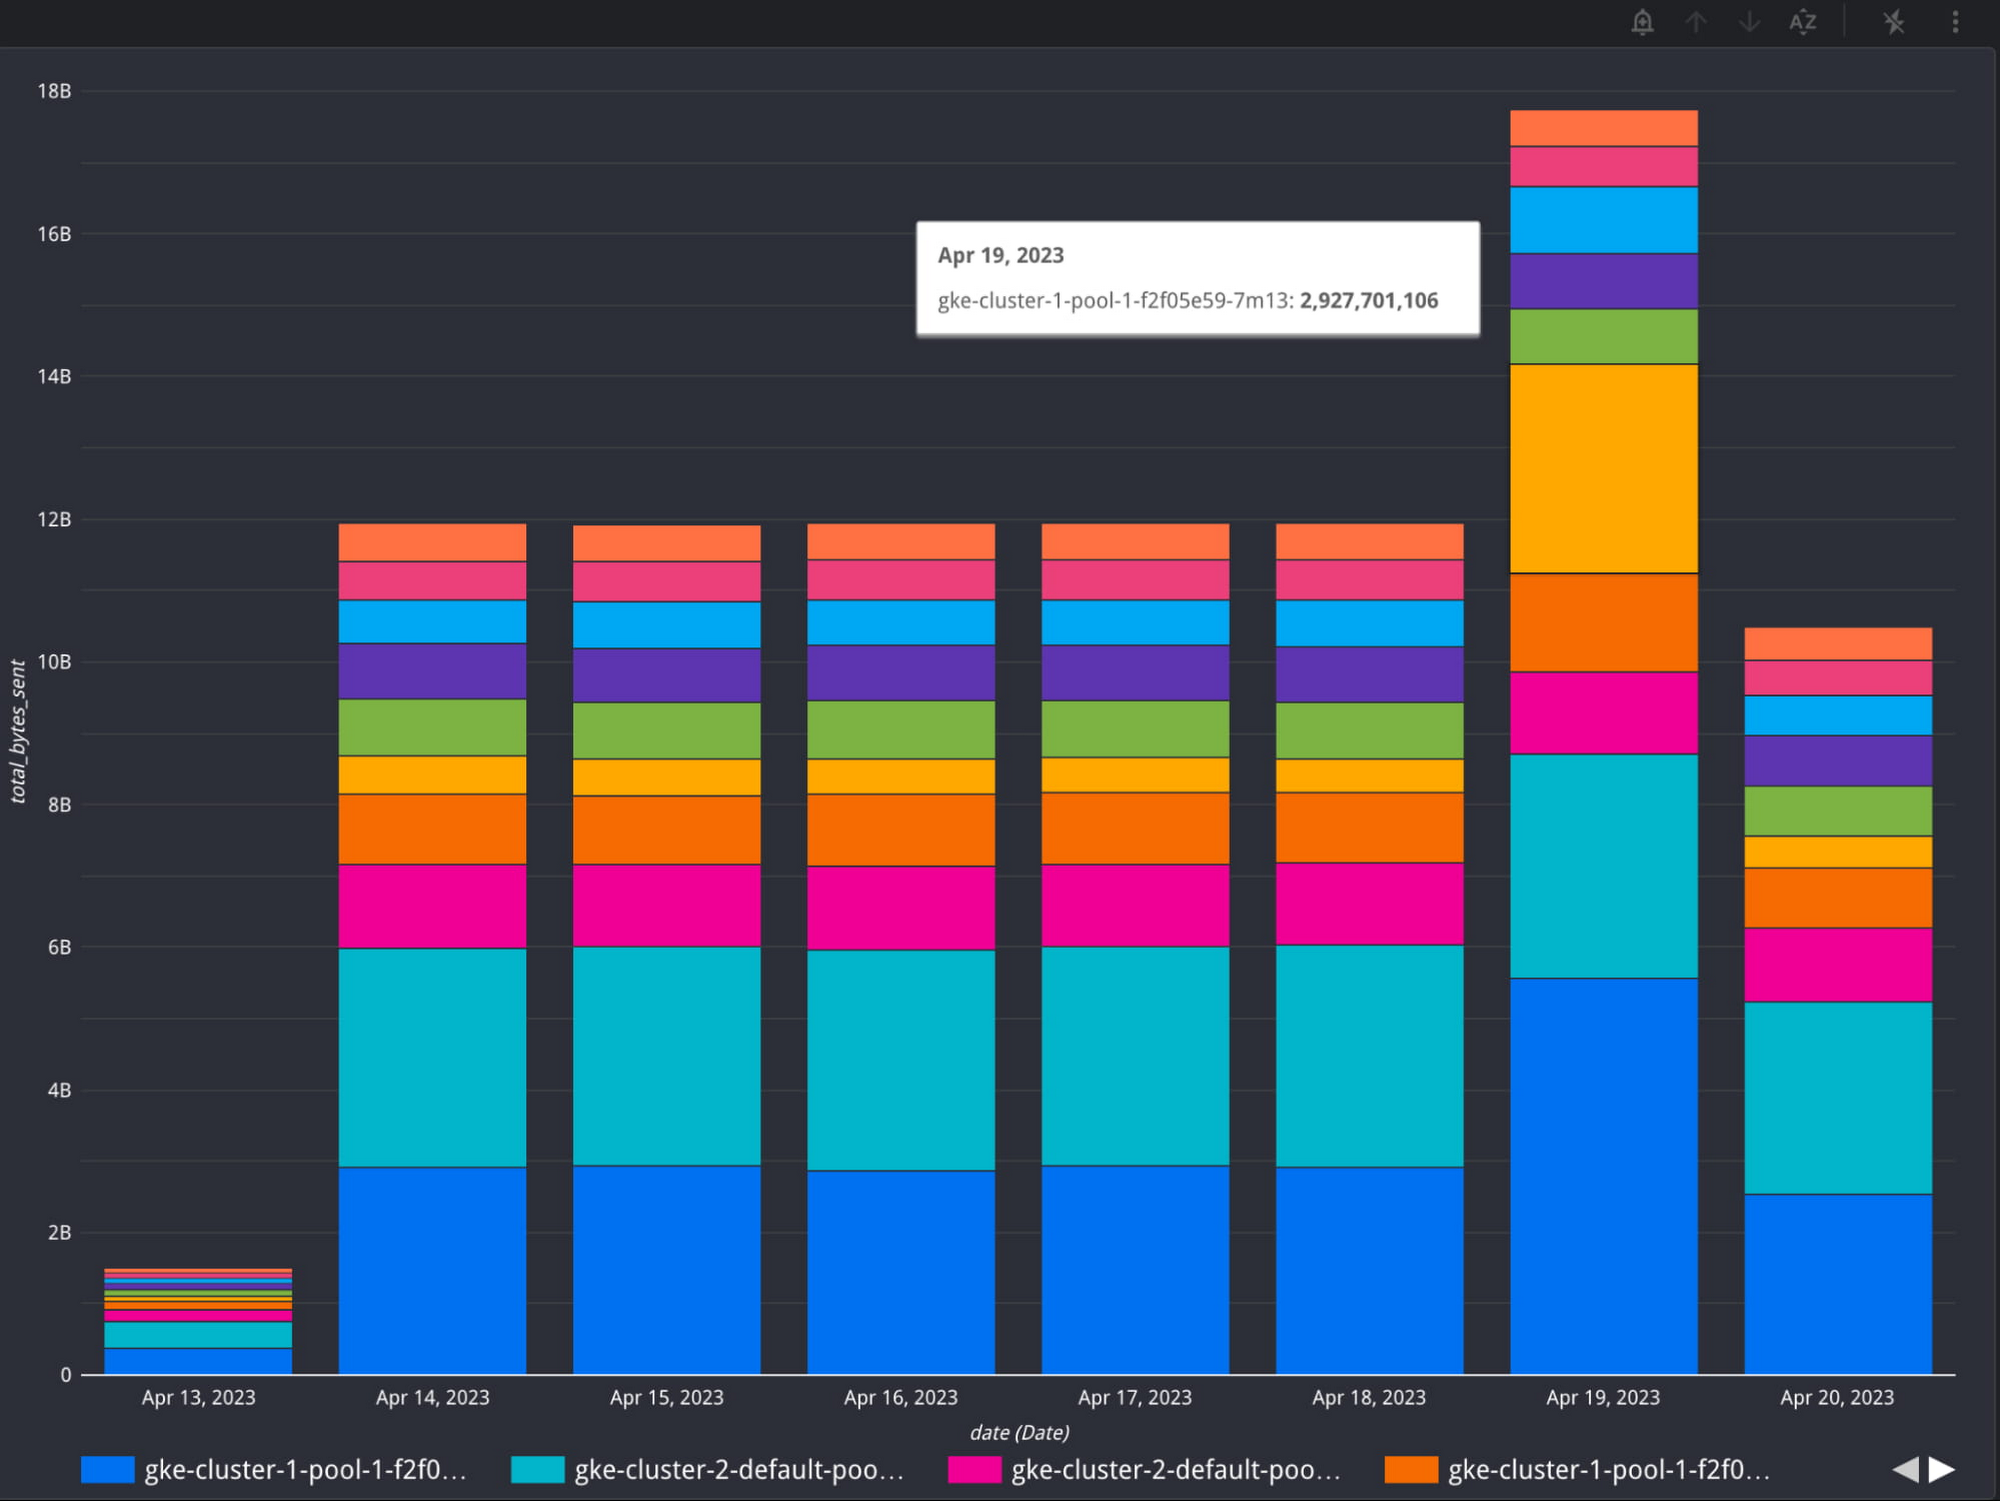
Looker Studio chart of Top Talkers over 1 week
Get started today
To get started with VPC Flow logs, enable VPC Flow Logs for a new or existing subnet. To get started with Log Analytics, you can upgrade your log buckets to use Log Analytics and check out our sample networking queries.
By Mary Colley, Product Manager | Charles Baer, Product Manager
Originally published at Google Cloud
Source: Cyberpogo
For enquiries, product placements, sponsorships, and collaborations, connect with us at [email protected]. We'd love to hear from you!
Our humans need coffee too! Your support is highly appreciated, thank you!