Imagine running a business without financial projections or even knowing how much money is left in the bank. How would you know if you are swimming in a huge cash buffer or if you need to skip a customer lunch due to insufficient funds? Without observing your financials it is simply impossible to run a healthy business. Similarly, without observing your computing infrastructure, it is impossible to keep an application running healthy.
In fact, observability is so critical that as of February 2021, the Cloud Native Computing Foundation (CNCF) lists 102 projects in that category. Observability is not only important, it is also expensive. Netflix is jokingly referred to as “a platform that produces massive amounts of logs, that happens to also stream videos”. Observability is expensive for two reasons:
From our partners:
- Observability needs to be at least one order of magnitude more reliable than the observed system. Otherwise, you will keep debugging your observability stack, instead of using it to keep your application running.
- Since you never really know what to observe, until after an incident, it is common to observe more than you need. A good car driver not only looks ahead, but keeps scanning the surroundings to avoid an accident.
In this post, let us dive deeper into observability: What it is, different types of observability and what it technically means to implement observability. At the end of this post, you will understand why you should resist the temptation to save a few bucks on observability.
What is observability?
Observability comes under many names, such as monitoring, auditing, telemetry, instrumenting. Ignoring the nuances, all these words essentially mean the same: Taking measurements of your infrastructure, platform and application to understand how it’s doing. As Peter Drucker used to say: “If you can’t measure it, you can’t manage it.”
If you are familiar with Lean Thinking — i.e., Build-Measure-Learn — then observability should come naturally to you. Observability closes the feedback loop via the “measure” phase. It allows your team to make rapid changes to an application, quickly adapt to its user base and environment, without unnecessary surprises. Good observability can convert “being woken up at 2am” into a mundane daily check.
But what is observability, really?
When talking about observability, we generally try to answer three questions:
- Are my users happy?
- Are my applications happy?
- Are my servers happy?
We do this via three means: traces, logs and metrics. The former produce more data, but not necessarily more insight. Nowadays, each of these is expected to be near-real-time. (Would you be okay with a heart rate monitor that tells you yesterday’s heart rate?)
Let us go through logging and metrics, the two you should definitely have.
Logging
While writing an application, your team will often add code for “logging”. These are explicit instructions to produce a log line, i.e., a bunch of meaningful text, when code execution passes through a major event. For example, “user X logged in” or “user Y authentication failure”, etc. These lines are what makes the difference between asking your customers “if they tried clearing their browser cache and reload” or actually investigating their complaint.
Logging is rather explicit: Your team needs to add logging code and needs to foresee what to log. The rule of thumb is that all major boundary events need to be logged. Some application bugs only manifest in production, so you should rather “over-log” than “under-log”. Otherwise, a lot of time is wasted hunting so-called Heisenbugs: bugs that are extremely difficult to reproduce, but nevertheless cause customer annoyance.
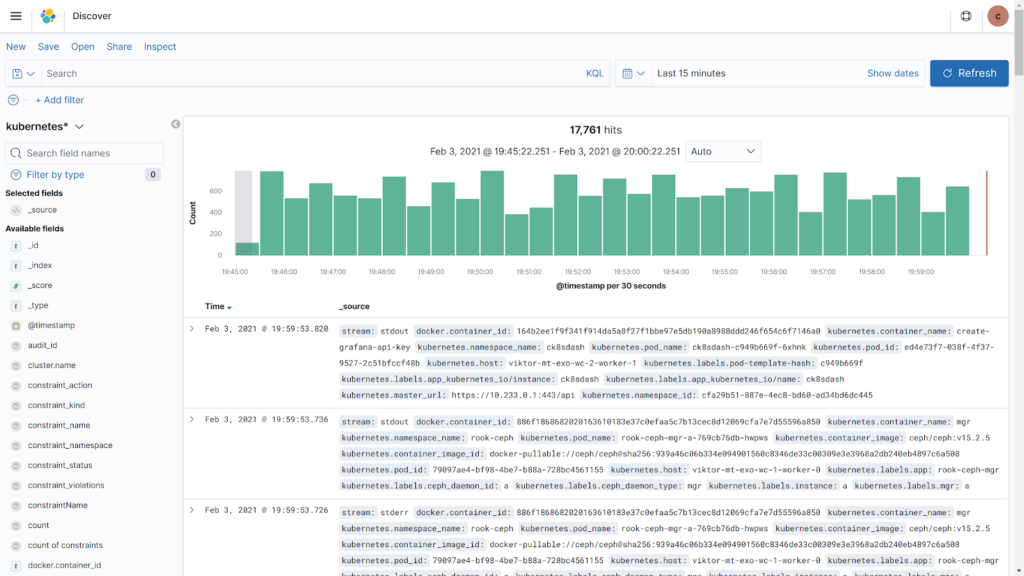
Logging produces massive amounts of data. To save costs, it’s best to think in terms of short-term and long-term logs. Short-term logs — e.g., the last 7 days — should be “googleable”, i.e., you should be able to perform a full-text search within seconds. Projects like Elasticsearch/Kibana and Loki are most suitable for this purpose.
Long-term logs are stored in whatever form is cheapest, usually object storage. They are not immediately “googleable”, then again, the likelihood of needing to search through them is small. In fact, if you want to err on the side of privacy, it might be good to avoid long-term logs.
Sometimes, you do not care about the exact log line, rather about the number of times a specific event occurred. This information could be extracted from logs, but there is a more efficient way: metrics.
Metrics
Metrics — also called Service Level Indicators (SLI) or Key Performance Indicators (KPI) — are time series of numeric values. Think of it like recording outside temperature in all major cities on an hourly basis. Metrics use the least amount of space and provide (for the space they use) the maximum amount of insight. They can record the number of hourly active users, the number of requests hitting your application, the amount of free disk space, etc. Keeping an eye on metrics ensures that your users get a great experience with your application, while also keeping infrastructure costs down.
Metrics are rather explicit. Your team needs to add code for collecting and also exposing a given metric. However, most commonly used tools out there, such as Nginx, Kubernetes or MySQL, already export a plethora of metrics, which should provide you with a good situational awareness.
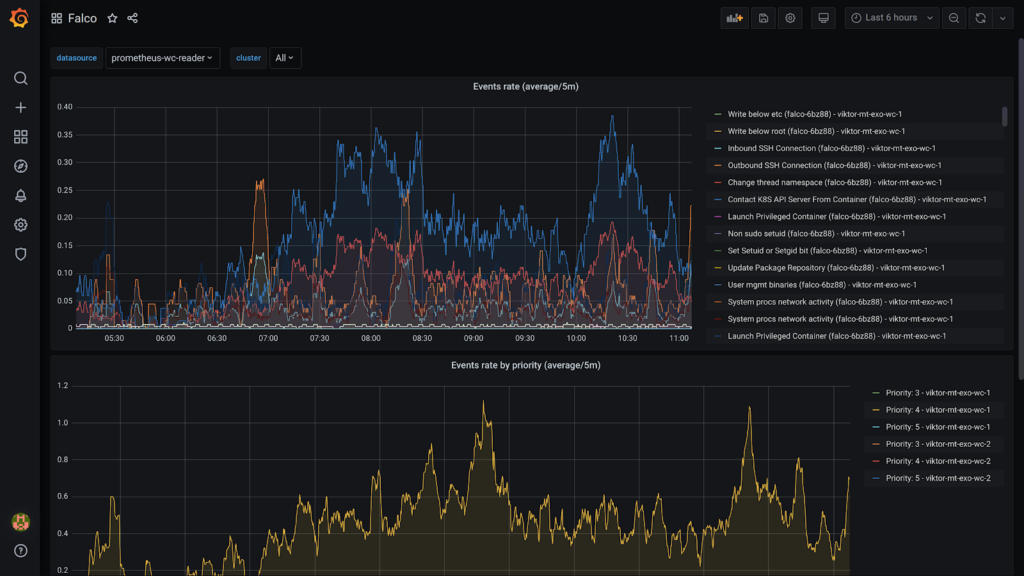
Projects like Prometheus can help you collect metrics with minimal support required from the application, while Grafana can help visualize them. In fact, I would argue that screens filled with Grafana dashboards make a nice decoration for office walls. You know, when going to the office for work becomes a thing again.
So far we talked about visualization, i.e., a more intentional form of observability. But what if the system needs attention here and now?
Alerts
Alerts are like the system “crying for help” requesting the attention of a human. Usually, if a given metric exceeds a threshold, the on-call person receives an email, an SMS, or a message on Slack or Microsoft Teams. An automatic escalation may be implemented, e.g., if the first on-call person does not respond to the alert within 30 minutes, the second on-call person is alerted.
Alerts are tricky. Too much alerting and the system is “crying wolf”. Your team will end up with “alert fatigue” and start ignoring even the important ones. Too little alerting and your customers will “do alerting” for you … this is usually not the preferred alerting channel, least your accountant complains about having to cash in too many invoices.
Therefore, the bar for “when to alert” should be high. Is this a “2am” or “mayday” event, i.e., should someone be woken up at night if this happens? Or is this a “pan-pan” event and can be dealt with during daytime?
Fortunately, projects like Prometheus, not only enable alerting, they can also perform predictions. Knowing that a disk will get full in 72 hours, can prevent both disappointing customers with a downtime and ruining a team member’s good night sleep.
Summary
Lack of observability is like driving with closed eyes: You can’t tell how close you are to a disaster. The faster you are driving and the busier the road, the more you should watch out.
Observability is the same: The faster you want your team to add features, the more you should invest in observability. And, while it may be tempting to save a few bucks on observability, those savings will quickly erode during the next slow-to-fix incident.
Looking for an open-source CNCF-certified Kubernetes distribution with pre-configured tools for logging, metrics and alerts? Check out the Compliant Kubernetes documentation and please consider staring it! We welcome contributions.
Guest post originally published on Elastisys’s blog by Cristian Klein, Sr Cloud Architect at Elastisys
Source CNCF
For enquiries, product placements, sponsorships, and collaborations, connect with us at [email protected]. We'd love to hear from you!
Our humans need coffee too! Your support is highly appreciated, thank you!