aster.cloud aster.cloud
  • /
  • Platforms
    • Public Cloud
    • On-Premise
    • Hybrid Cloud
    • Data
  • Architecture
    • Design
    • Solutions
    • Enterprise
  • Engineering
    • Automation
    • Software Engineering
    • Project Management
    • DevOps
  • Programming
    • Learning
  • Tools
  • About
  • /
  • Platforms
    • Public Cloud
    • On-Premise
    • Hybrid Cloud
    • Data
  • Architecture
    • Design
    • Solutions
    • Enterprise
  • Engineering
    • Automation
    • Software Engineering
    • Project Management
    • DevOps
  • Programming
    • Learning
  • Tools
  • About
aster.cloud aster.cloud
  • /
  • Platforms
    • Public Cloud
    • On-Premise
    • Hybrid Cloud
    • Data
  • Architecture
    • Design
    • Solutions
    • Enterprise
  • Engineering
    • Automation
    • Software Engineering
    • Project Management
    • DevOps
  • Programming
    • Learning
  • Tools
  • About
  • Public Cloud

Learn How To Create Alerts Based On Your Database Logs In Cloud SQL

  • aster.cloud
  • September 29, 2021
  • 3 minute read

Imagine if you could remember everything you’ve ever done with perfect recall. Humans may not be able to, but databases don’t forget — every single alteration to your data can be recorded and logged, from an automated backup to a query. As such, logs are extremely useful when troubleshooting database behaviour. Cloud SQL uses Cloud Logging to store various kinds of logs so you can better understand what your database is doing and when those events happen, from engine logs to Cloud SQL Auth proxy logs to audit logs.

In this blog, I will show you how to view logs for your Cloud SQL instances, create a metric based on those logs to see how many deadlocks happen in your database, and create an alert based on that metric. I’ll use Logs Explorer, a visual tool in the Cloud Console that allows for easy filtering and provides handy histograms for ease of navigation. Keep in mind that logs can also be explored using the gcloud command line tool.


Partner with aster.cloud
for your next big idea.
Let us know here.


From our partners:

CITI.IO :: Business. Institutions. Society. Global Political Economy.
CYBERPOGO.COM :: For the Arts, Sciences, and Technology.
DADAHACKS.COM :: Parenting For The Rest Of Us.
ZEDISTA.COM :: Entertainment. Sports. Culture. Escape.
TAKUMAKU.COM :: For The Hearth And Home.
ASTER.CLOUD :: From The Cloud And Beyond.
LIWAIWAI.COM :: Intelligence, Inside and Outside.
GLOBALCLOUDPLATFORMS.COM :: For The World's Computing Needs.
FIREGULAMAN.COM :: For The Fire In The Belly Of The Coder.
ASTERCASTER.COM :: Supra Astra. Beyond The Stars.
BARTDAY.COM :: Prosperity For Everyone.

Navigate to logs

The easiest way to find logs for a specific Cloud SQL instance is to:

  • Navigate to an instance overview page in Cloud Console
  • Scroll down to the “Operations and logs” card, and click “View [database engine] error logs”
1 database log insights.jpg

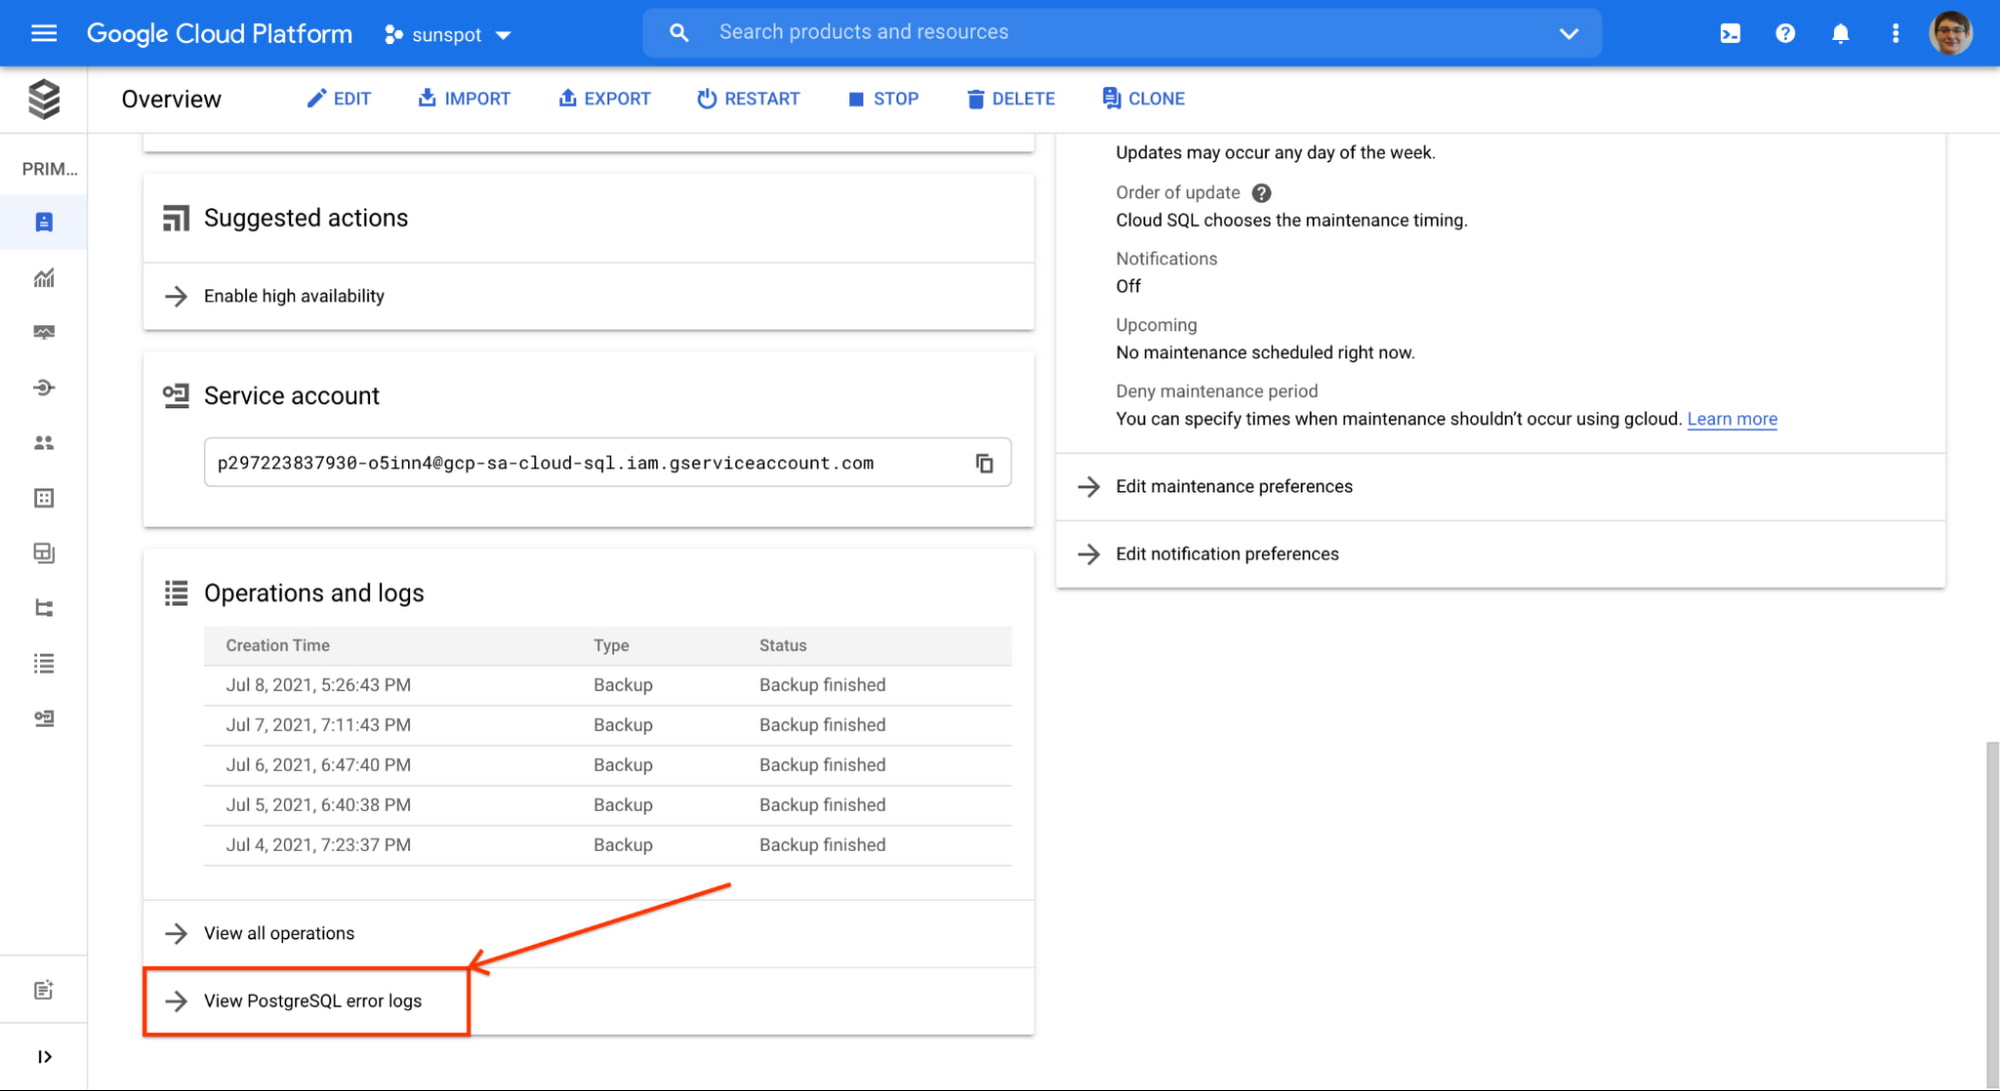
You will be redirected to Logs Explorer, pre-filtered to show logs for that specific instance.

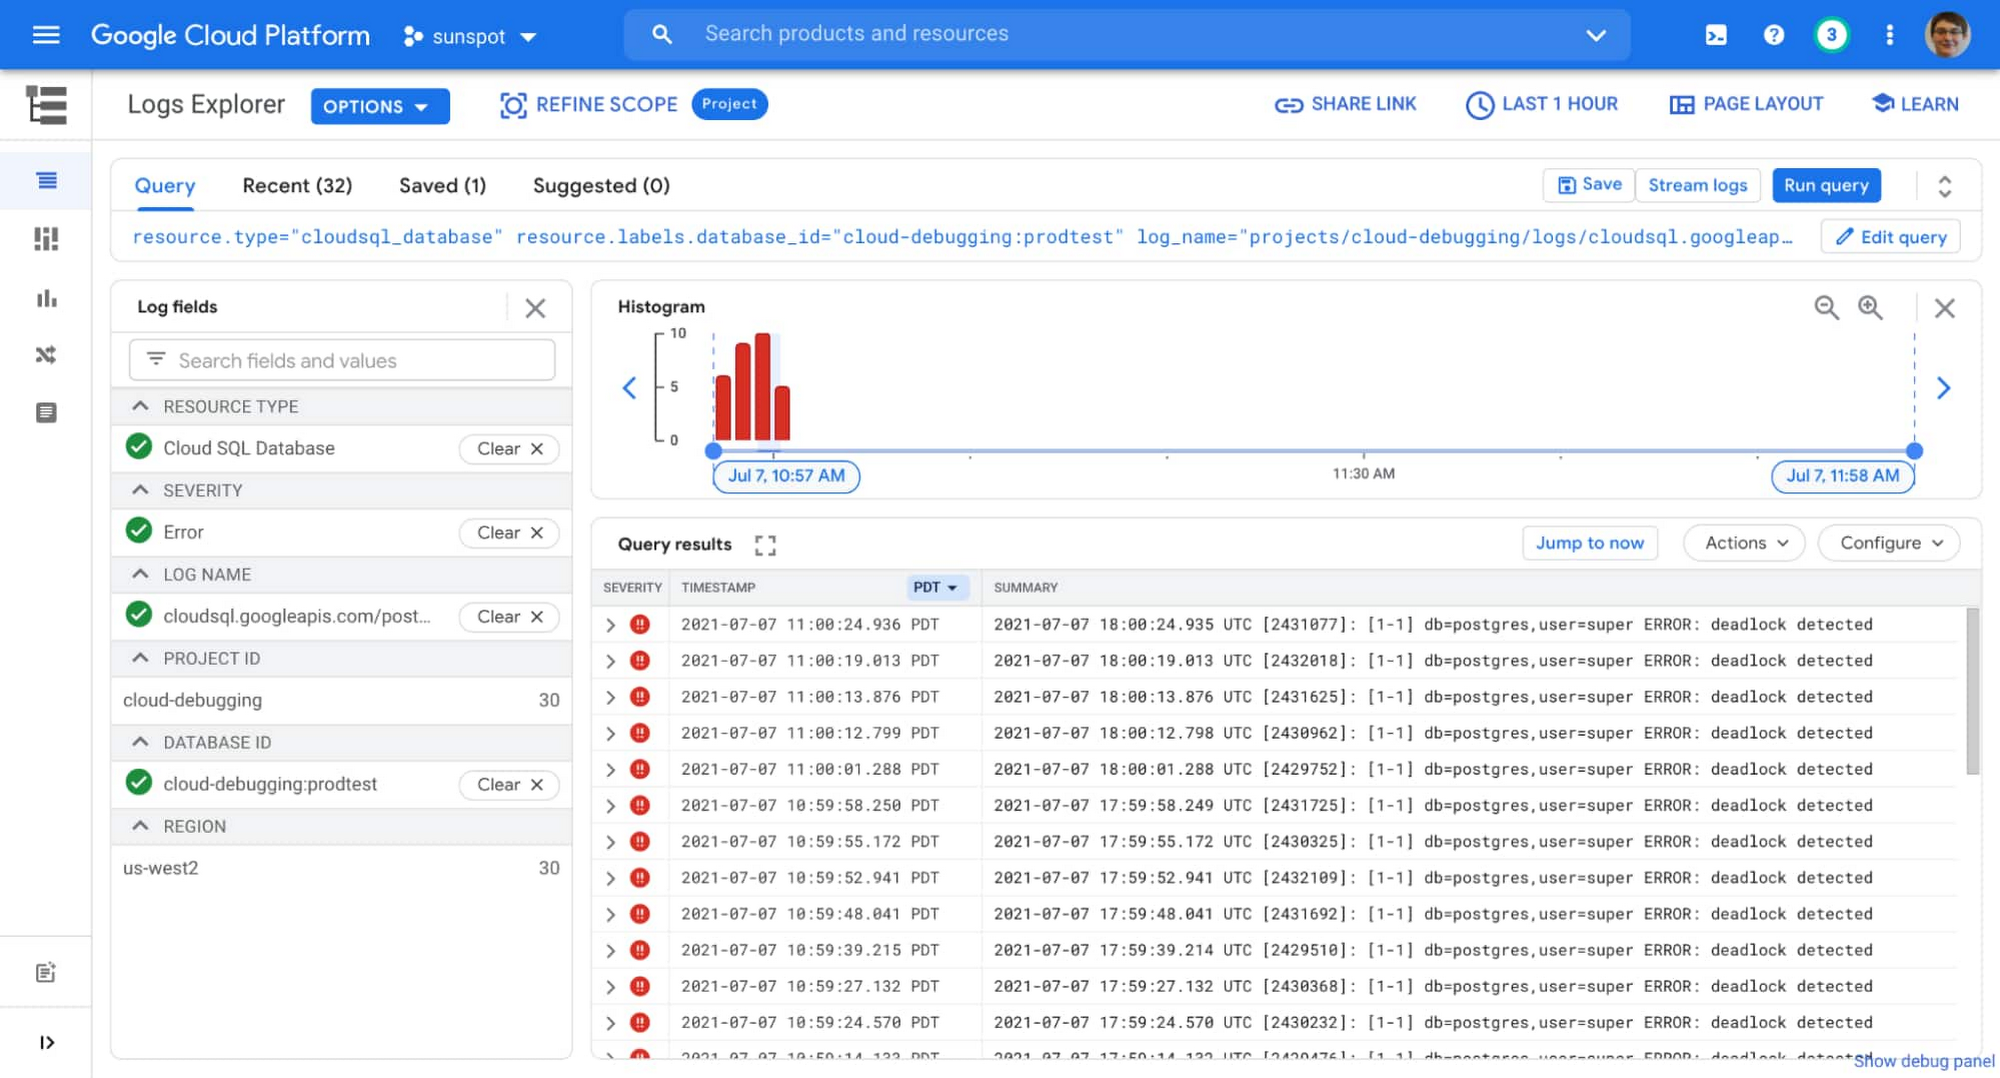
You can filter the logs further to show only errors by using the “Log fields” filter on the left.

Once you apply the filter, you might be in the situation I found myself in: the same error (in my case “deadlock detected”) showing up many times in my instance’s log list:

Read More  VMware Helps Cloud Providers Globally Capture The Demand For Sovereign Cloud Services
2 database log insights.jpg

I can use the UI to investigate further, looking at how often this happens and which database it happens to (is it always the same one?). But I don’t always have to return to this list to monitor the situation. I can create a chart on my dashboard that will show me how often this is happening, and build an alert based on that chart to notify me if the situation escalates.

There is an existing metric logging.googleapis.com/log_entry_count that shows how many entries of a given severity are ingested into the logs. But I am not interested in all errors, I specifically want to know how many errors with message “deadlock detected” were logged, and which databases in my instance are affected.

Here’s where logs-based metrics enter the picture, a way to create time series metrics based on the content of your logs.

Creating logs-based metric

The log entry I am interested in has a very specific format (you can see it if you expand any of query results shown in the image above):

{
  "textPayload": "2021-07-07 19:15:37.996 UTC [2473691]: [1-1] db=postgres,user=super ERROR:  deadlock detected",
  "insertId": "...",
  "resource": {
    "type": "cloudsql_database",
    "labels": {
      ...
    }
  },
  "timestamp": "...",
  "severity": "ERROR",
  "logName": "projects/cloud-debugging/logs/cloudsql.googleapis.com%2Fpostgres.log",
  "receiveTimestamp": "..."
}

This means I can parse database and user information from the log, and add that info as labels to my logs-based metric.

Following these instructions I create a following logs-based metric:

  • name: pg_deadlocks
  • metric type: counter
  • filter selection (notice how it matches values from sample log entry above):
resource.type="cloudsql_database"
log_name="projects/cloud-debugging/logs/cloudsql.googleapis.com%2Fpostgres.log"
severity=ERROR
textPayload:"deadlock detected"
  • “database” label:
    • field name: textPayload
    • regular expression: db=(\w+)
  • “user” label:
    • field name: textPayload
    • regular expression: user=(\w+)
Read More  Clouds In The Cloud: Weather forecasting In Google Cloud

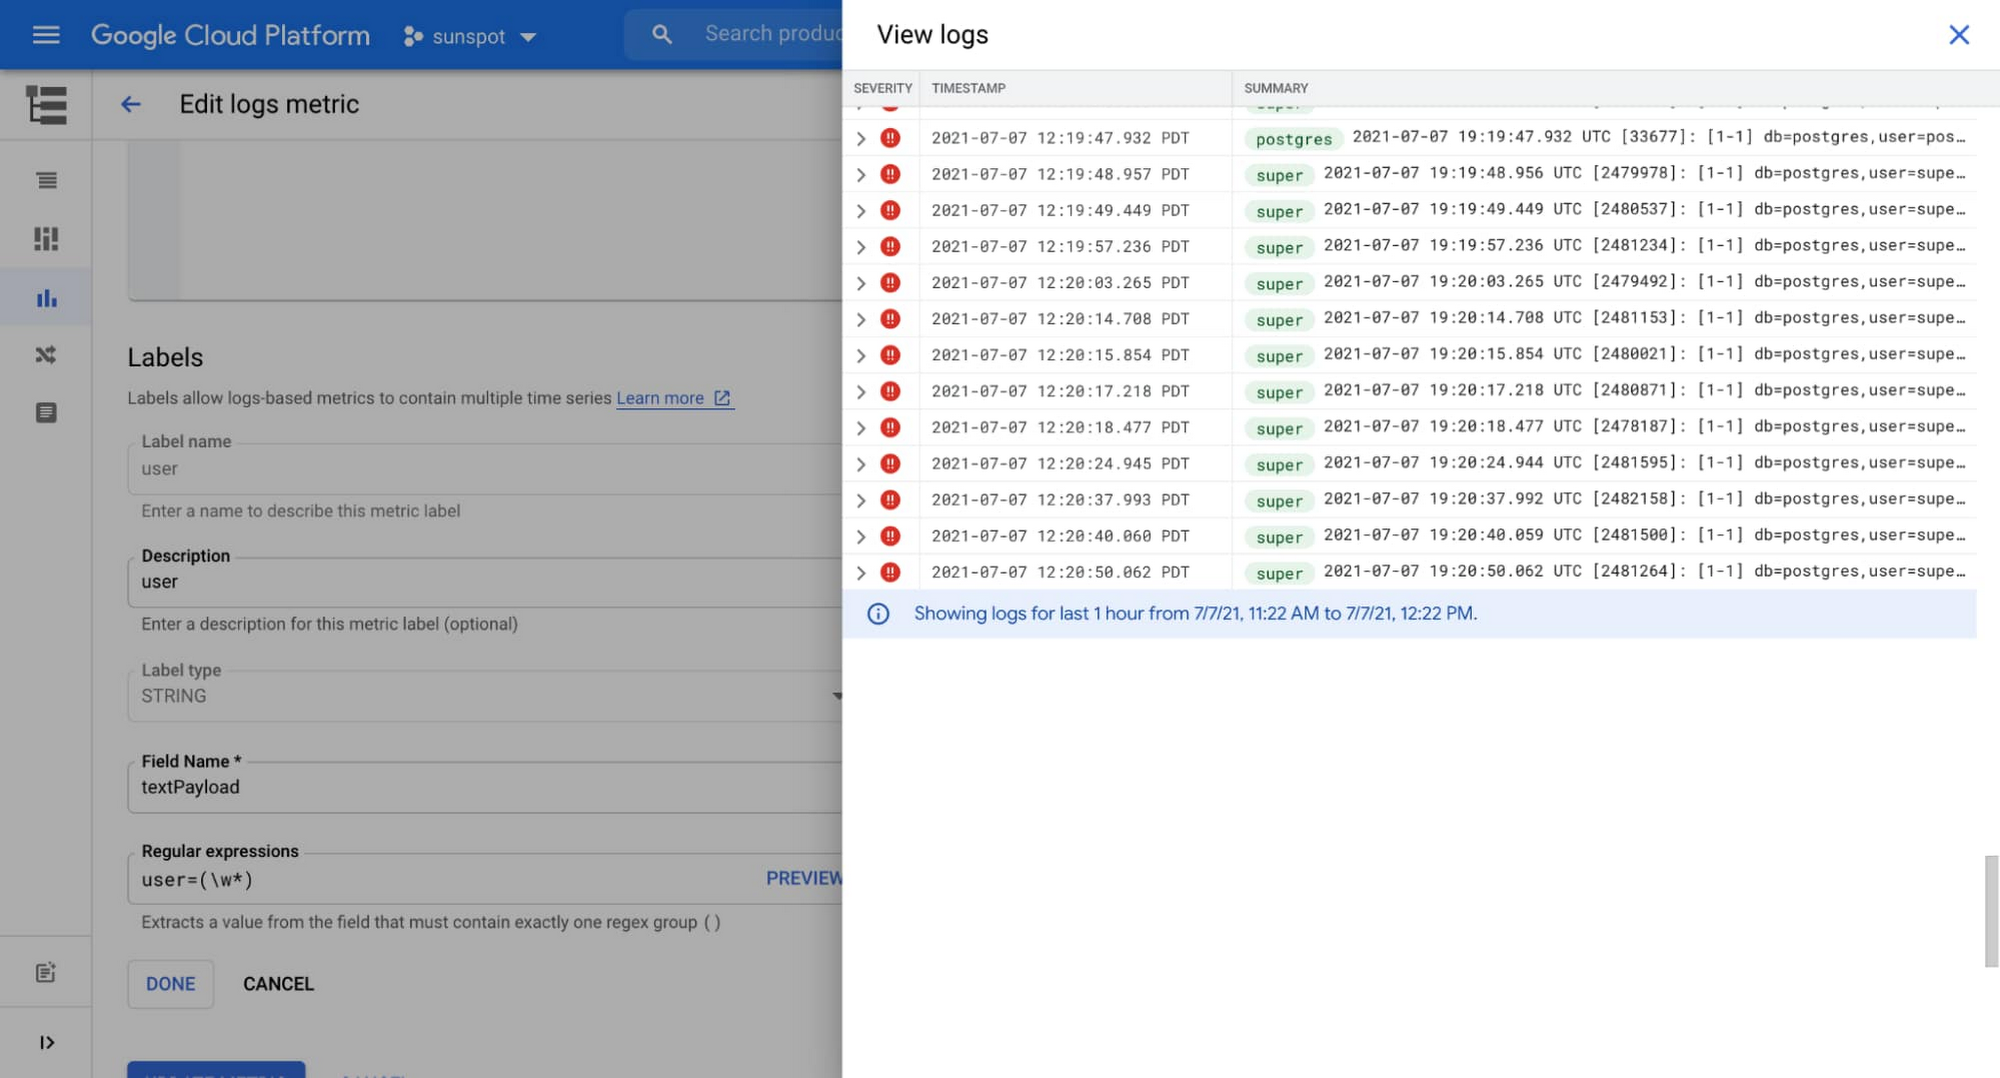
Cloud Console is really helpful when creating labels, it provides a preview UI for the regular expression (see the words highlighted in green on this screenshot):

3 database log insights.jpg

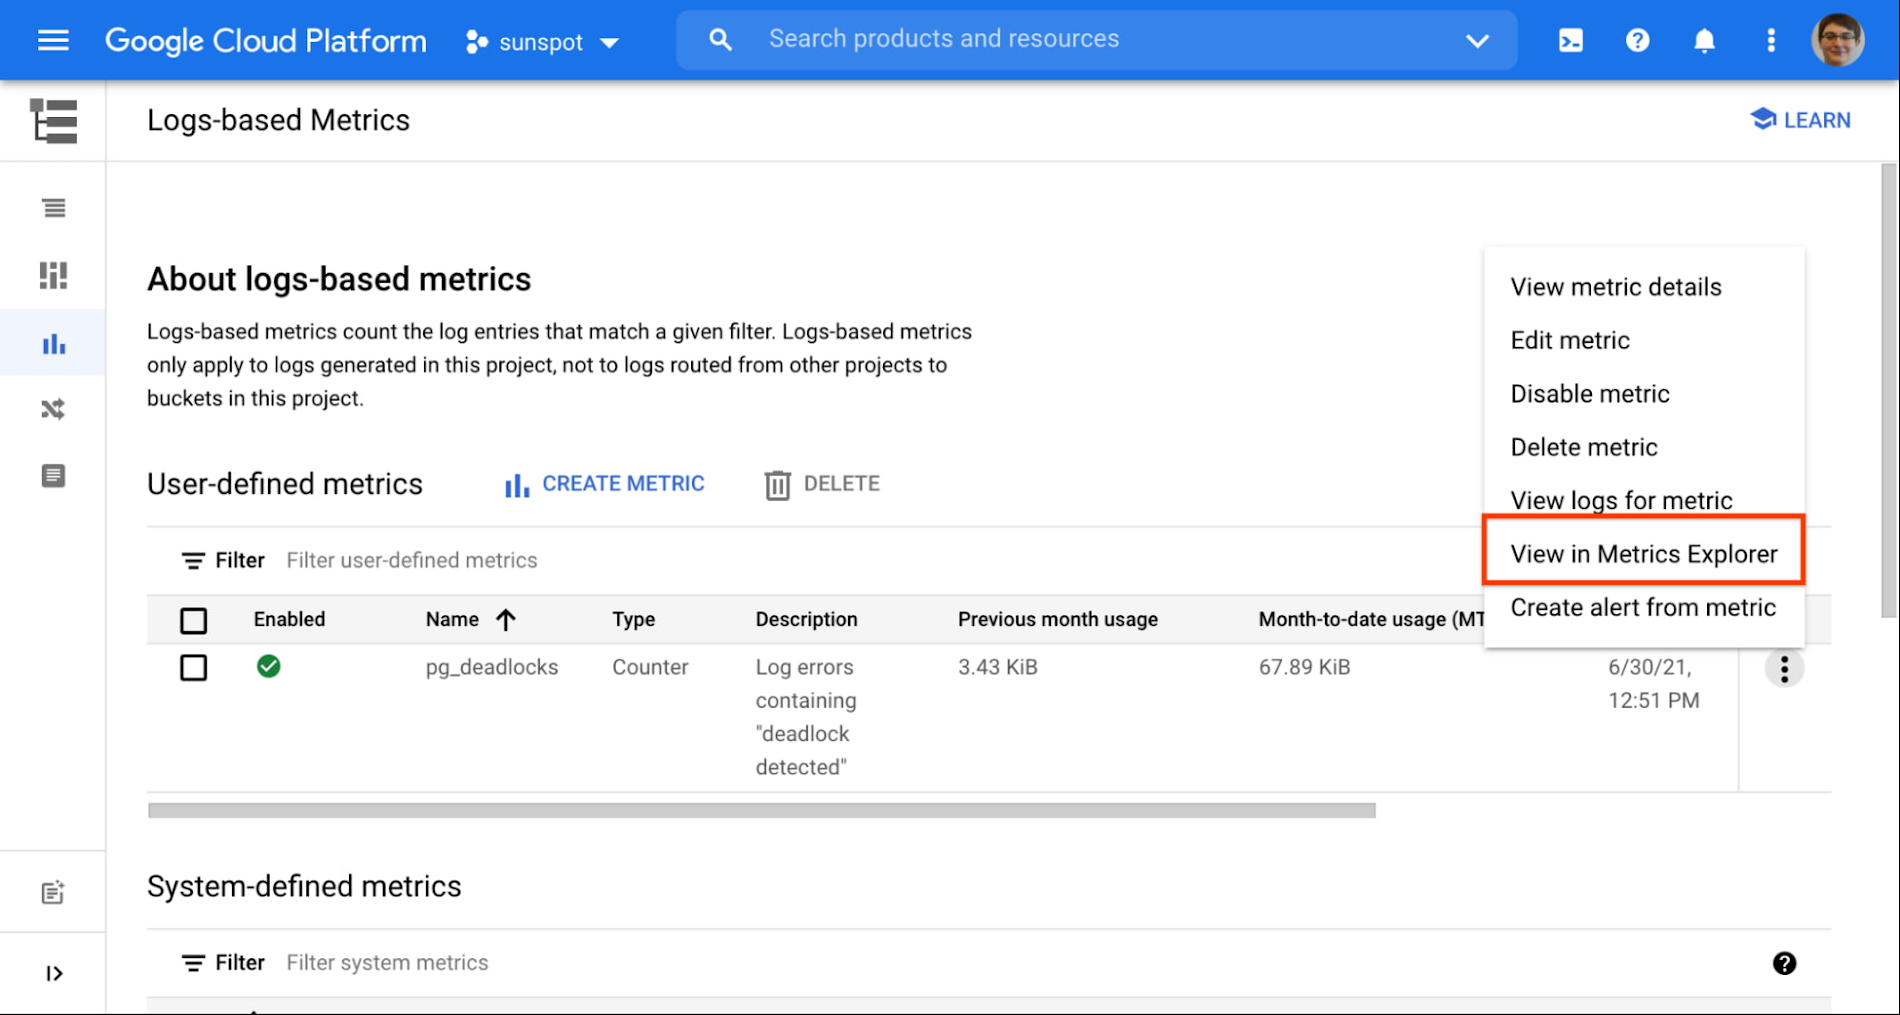
After a couple of minutes my newly created metric starts showing some data. I use the handy link to see the metric in Metrics Explorer:

4 database log insights.jpg

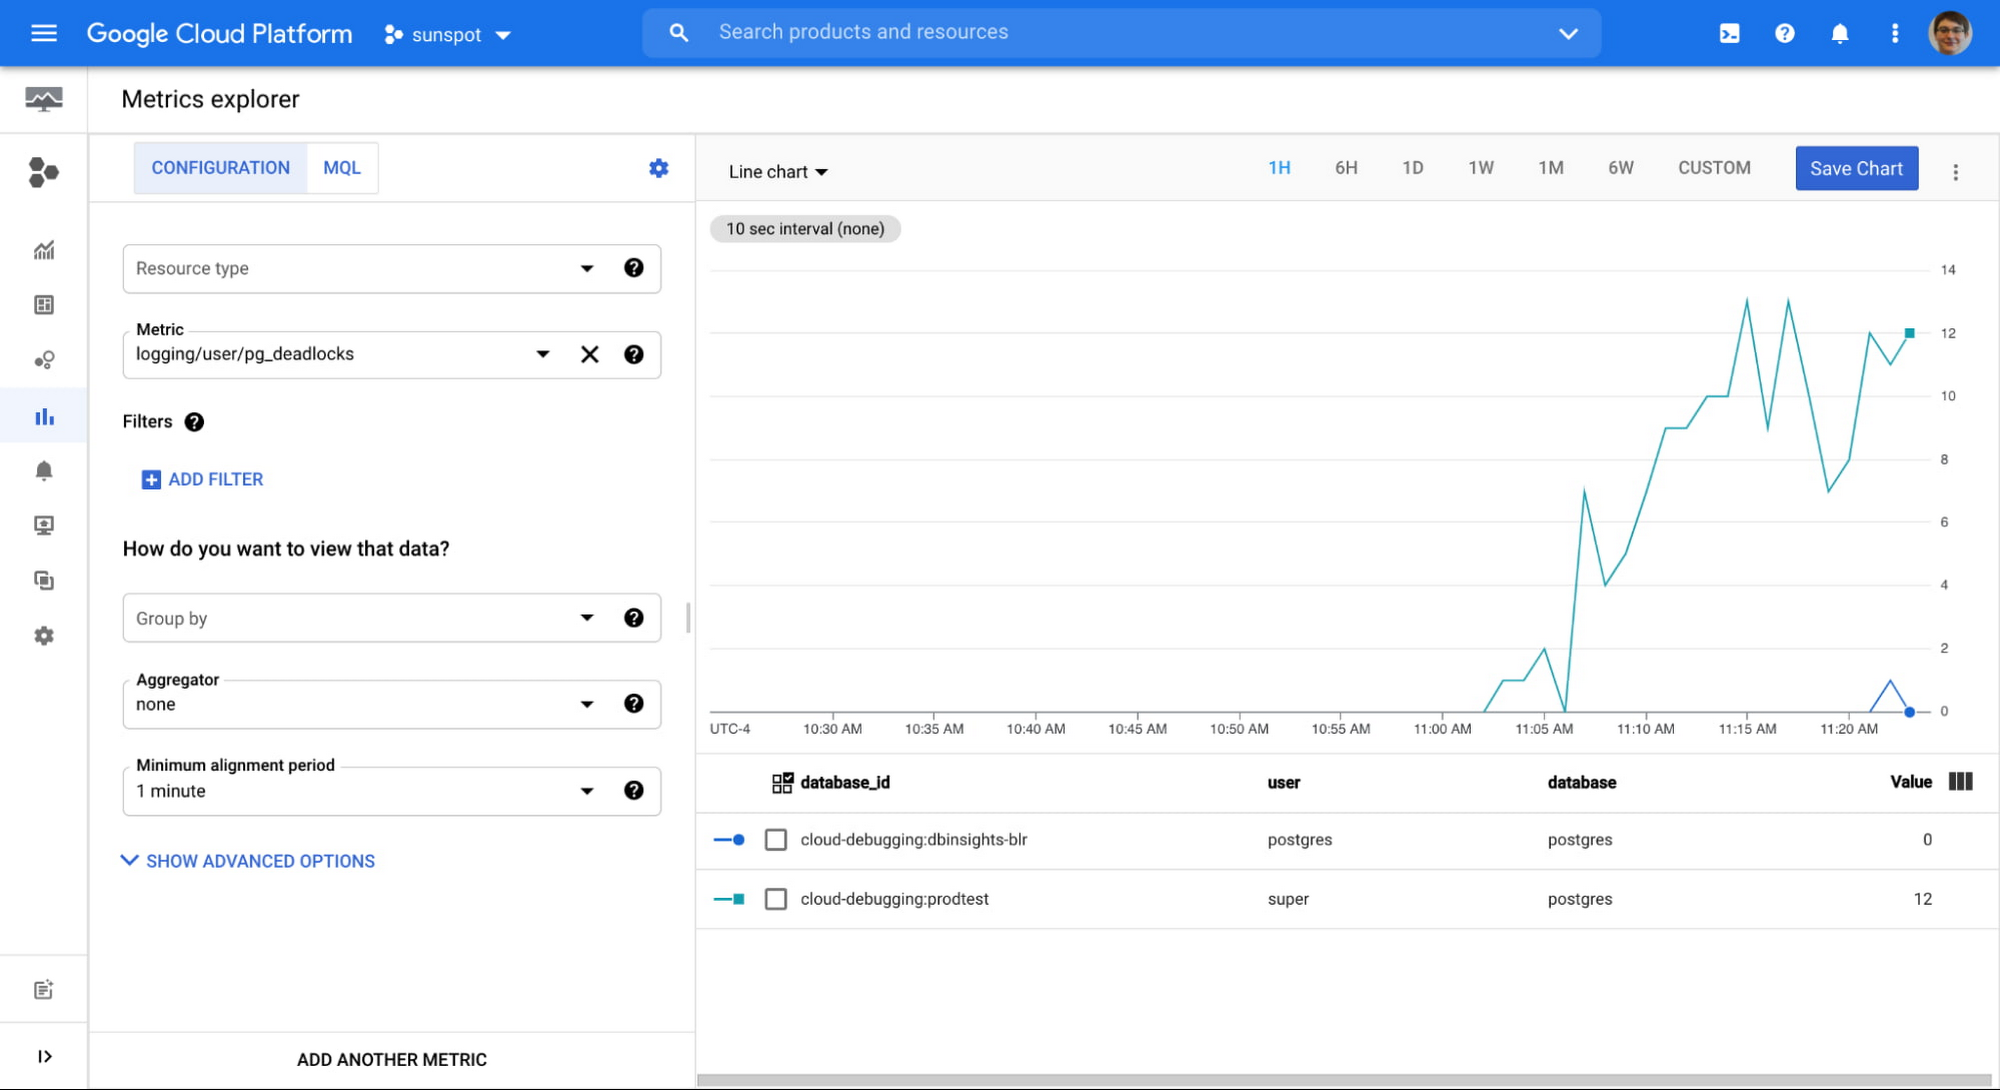
I confirm that data is gathered correctly, and both user and database information is extracted:

5 database log insights.jpg

From this point on, this metric behaves as any other system metric: you can add it to dashboards, or create alerts based on the value. You can even export them to your Application Performance Monitoring (APM) tool of choice.

Important notes about logs-based metrics:

  • They start gathering data from the moment the metric is created, there is no backfill,
  • They need to be defined in each GCP project separately,
  • They are chargeable metrics, consult pricing documentation.

This is just one example of additional value you can get from your logs. You can use the same steps to create more metrics, creating Insights specific to your particular situation.

Try this on your Cloud SQL instance today!


By Urszula Krukar, Software Engineer
Source Google Cloud Blog


For enquiries, product placements, sponsorships, and collaborations, connect with us at [email protected]. We'd love to hear from you!

Our humans need coffee too! Your support is highly appreciated, thank you!

aster.cloud

Related Topics
  • Cloud Logging
  • Cloud SQL
  • Google Cloud
You May Also Like
View Post
  • Public Cloud

Connecting AI agents with unstructured data using Google Cloud Storage MCP Servers

  • June 10, 2026
Data center
View Post
  • Data
  • Public Cloud

Data Sovereignty in Spain. It’s Not Just About the Law, It’s About Efficiency

  • June 3, 2026
View Post
  • Data
  • Platforms
  • Public Cloud

PayPal’s historically large data migration is the foundation for its gen AI innovation

  • March 4, 2026
Google Cloud and ElevenLabs
View Post
  • Public Cloud
  • Technology

ElevenLabs Partners with Google Cloud for Cloud Services and the Latest NVIDIA Blackwell GPUs

  • February 26, 2026
View Post
  • Public Cloud

Delivering a secure, open, and sovereign digital world

  • February 12, 2026
View Post
  • Public Cloud

Formula E and Google Cloud Announce Multi-Year ‘Principal Partnership’

  • January 26, 2026
View Post
  • Public Cloud

Sawasdee Thailand! Google Cloud launches new region in Bangkok

  • January 23, 2026
View Post
  • Public Cloud

Retailers Help Mitigate Risk with Oracle’s AI-Driven Supply Chain Collaboration

  • January 11, 2026

Stay Connected!
LATEST
  • digital-nomad-freelancer-worker-2151205464 1
    One paperwork problem – Get your Digital Nomad Visa employment documents fast from UK, EU or Singapore
    • June 16, 2026
  • 2
    Samsung Art Store Brings Art Basel to Homes Worldwide With New Curated Collection
    • June 15, 2026
  • 3
    You Do Not Need to Invest in the IPO of SpaceX, Anthropic, and OpenAI
    • June 10, 2026
  • 4
    The consequences of relying on AI for accurate news
    • June 10, 2026
  • 5
    Connecting AI agents with unstructured data using Google Cloud Storage MCP Servers
    • June 10, 2026
  • 6
    WWDC26: Apple unveils next generation of Apple Intelligence, Siri AI, powerful parental controls, and an expansive set of software improvements
    • June 8, 2026
  • 7
    IBM and Google Cloud Announce Strategic Partnership to Scale AI with Human Expertise and AI‑Powered Delivery
    • June 4, 2026
  • Data center 8
    Data Sovereignty in Spain. It’s Not Just About the Law, It’s About Efficiency
    • June 3, 2026
  • 9
    Ink vs Pixels. What you miss versus what you are actually missing.
    • June 1, 2026
  • 10
    Banks race to patch new cyber vulnerabilities, and other cybersecurity news
    • May 25, 2026
about
Hello World!

We are aster.cloud. We’re created by programmers for programmers.

Our site aims to provide guides, programming tips, reviews, and interesting materials for tech people and those who want to learn in general.

We would like to hear from you.

If you have any feedback, enquiries, or sponsorship request, kindly reach out to us at:

[email protected]
Most Popular
  • pope-leo-xiv-cq5dam-1500.844 1
    Pope Leo XIV to Publish First Encyclical on Artificial Intelligence and Human Dignity on 25 May
    • May 22, 2026
  • 2
    Portfolio to Clients, and is Strengthened by Ongoing Project Glasswing Work
    • May 20, 2026
  • reMarkable Paper Pure 3
    Everything The reMarkable Paper Pure Actually Does
    • May 14, 2026
  • 4
    Scaling cloud and AI: Microsoft Azure’s commitment to Europe’s digital future
    • May 11, 2026
  • Anthropic Institute 5
    Introducing The Anthropic Institute
    • March 11, 2026
  • /
  • Technology
  • Tools
  • About
  • Contact Us

Input your search keywords and press Enter.