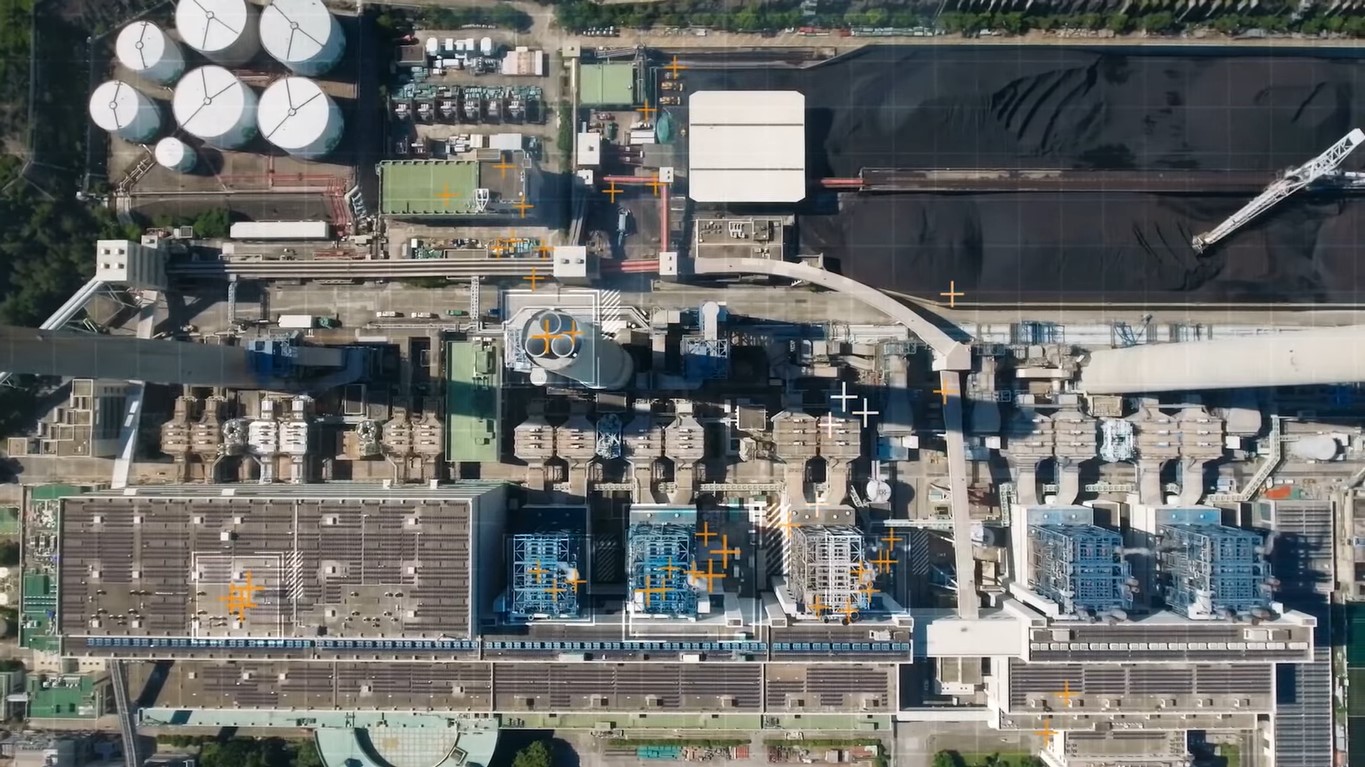
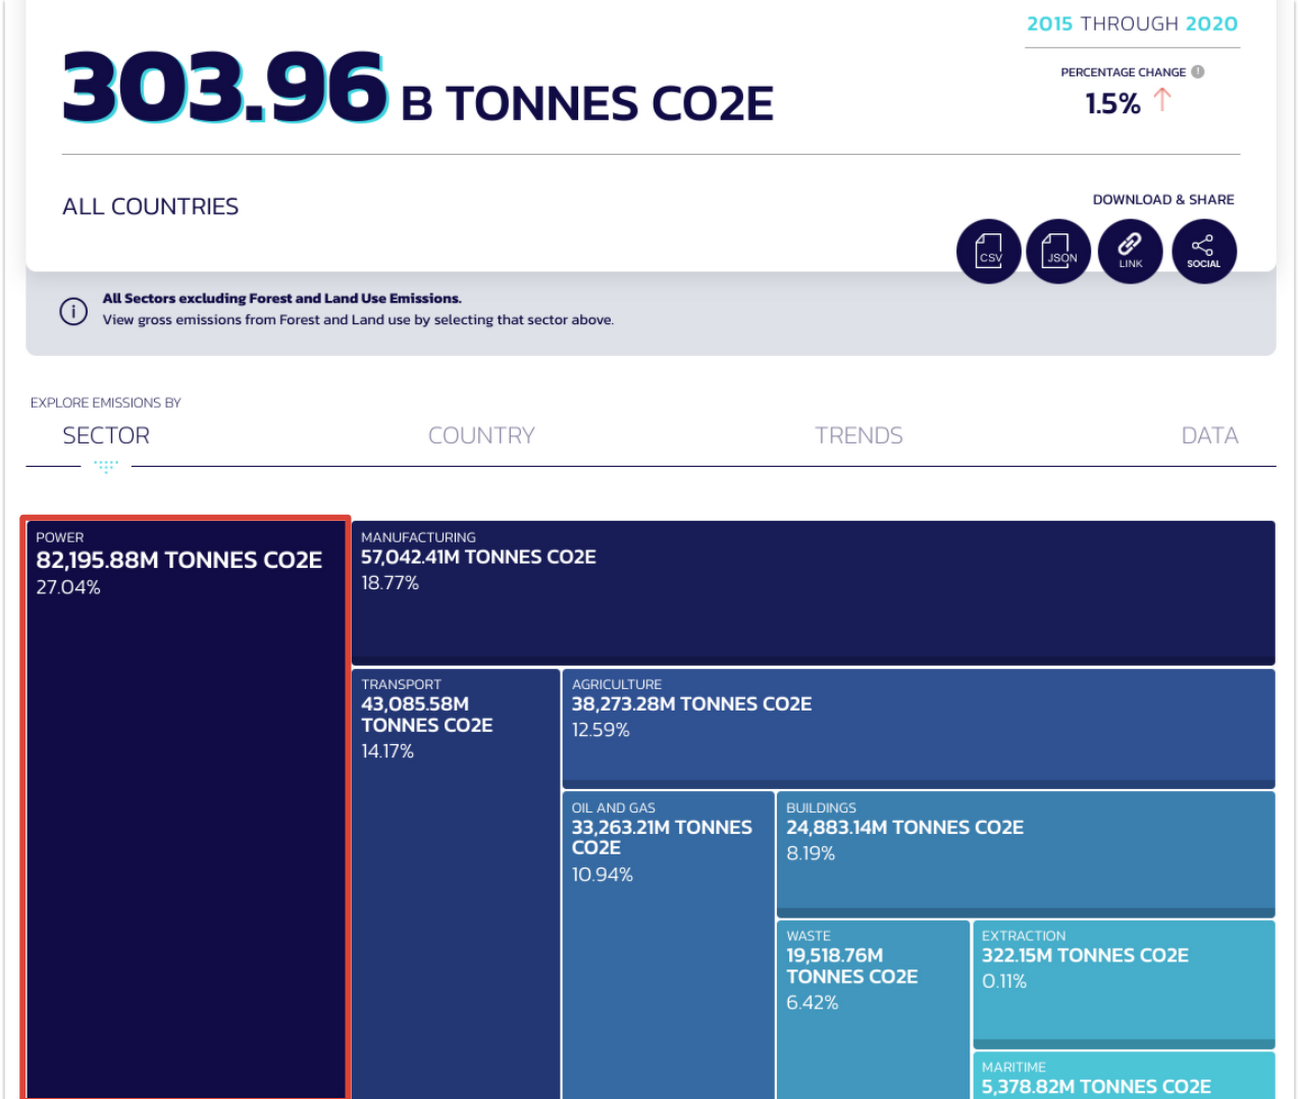
As we continue to explore climate solutions using machine learning in our People & Planet AI YouTube series, we have been blown away by an amazing project called Climate TRACE. It is a collaborative data sharing effort across 50+ organizations with the intention of helping the public (for free) to view where carbon pollution is emitted by country and even by industry, in a meaningful and visual way as a web app.
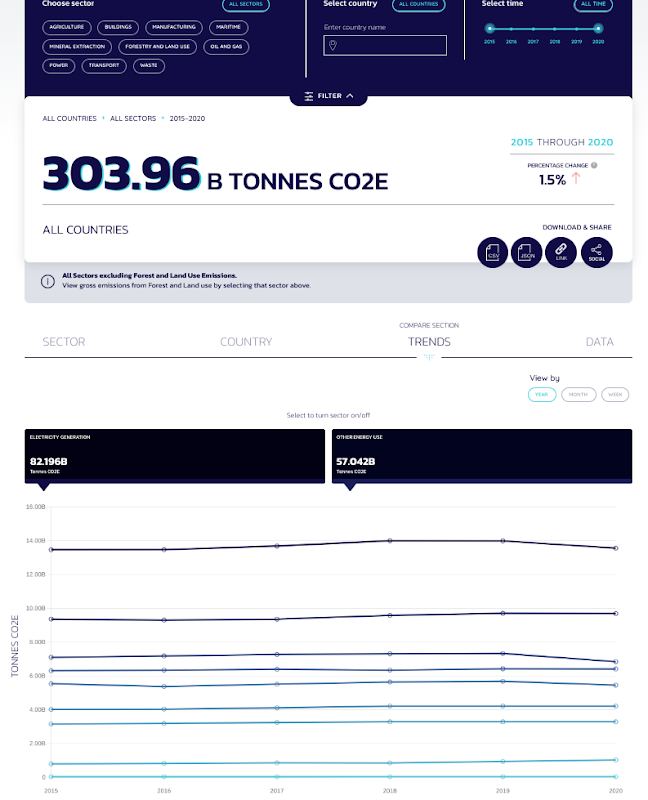
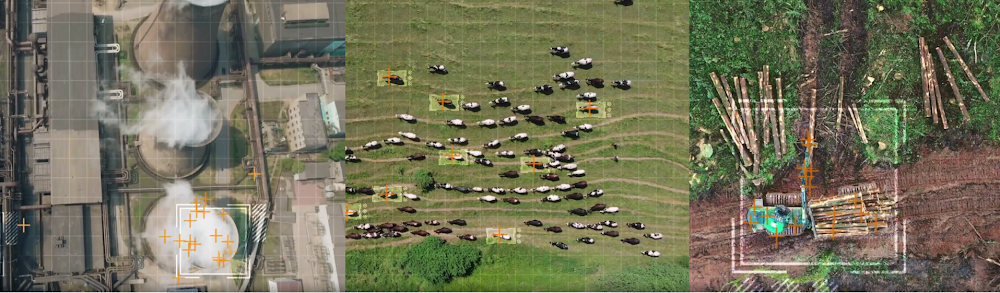
Soon it will feature where pollution arises at the source of a specific factory, an agricultural field, an animal farm, energy plant, etc; using satellite images and machine learning.
From our partners:
We interviewed Gavin McCormick, who is Executive Director at WattTime, which is one of the 10 main organizations leading this initiative. WattTime’s core mission has been to explore since its inception “how clean is the energy I use.” Gavin shared in our episode how historically it has been extremely challenging to accurately measure carbon emissions globally due to the lack of universal standards and enforcement. It has also been historically cost prohibitive for organizations to purchase equipment that helps track the source and quantity of their emissions. This is why Al Gore has also been a major advocate for the project, since this project is helping bridge emissions data across regions and sectors.
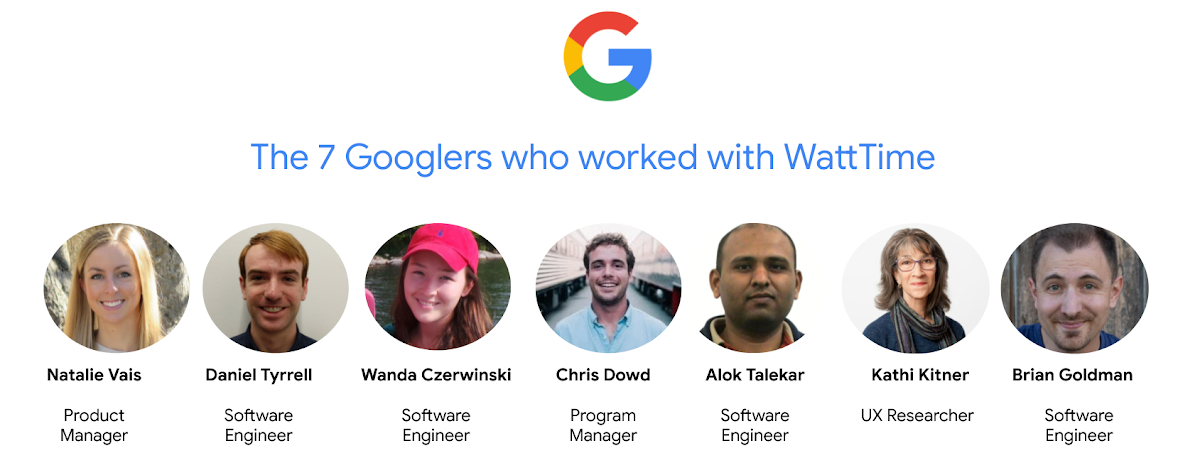
Presently all the compute processing that classifies the over 59 trillion bytes of data from close to 11,000 sensors, from over 300 satellites, is done on Google Cloud. Google.org both provided a grant to help fund the initiative, and staffed the project with many passionate volunteering Googlers in the fields of AI, UX, data analytics, etc.

Inspired from this effort, we dedicated this episode to helping developers build a geo-classification model (which is a model that classifies satellite images). Because the energy sector is one of top priority:
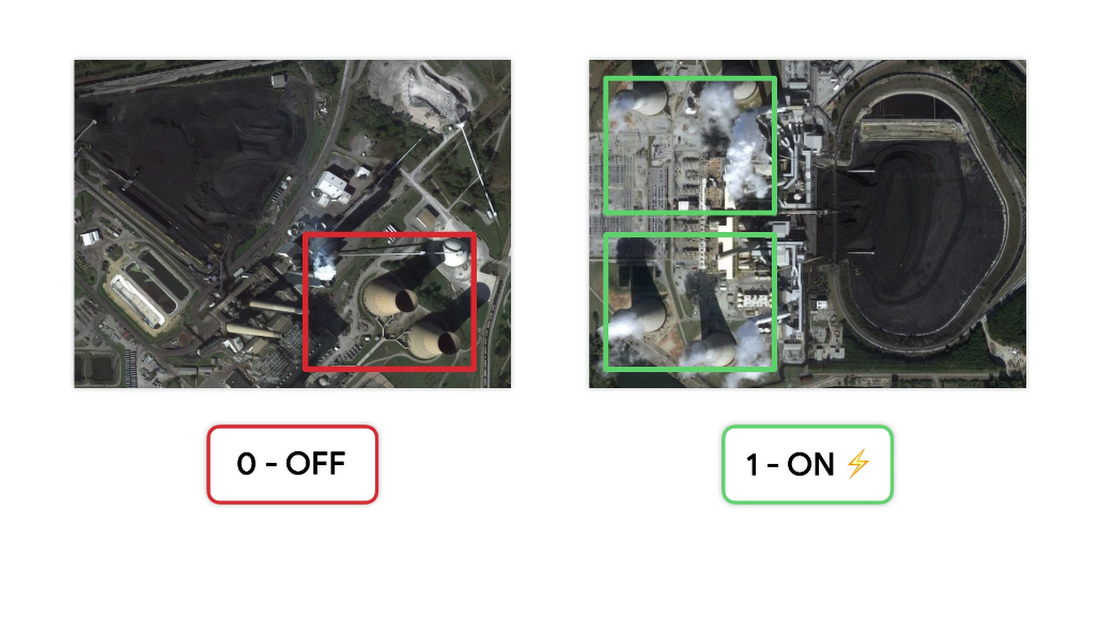
…we show you how to create a model that classifies satellite images of coal plants in our sample. It uses Google Earth Engine’s European satellite data from Sentinel 2, and via Cloud products, labels them if they are ON (emitting) or OFF (not emitting). The total cost for this project is around $1 (price breakdown below).
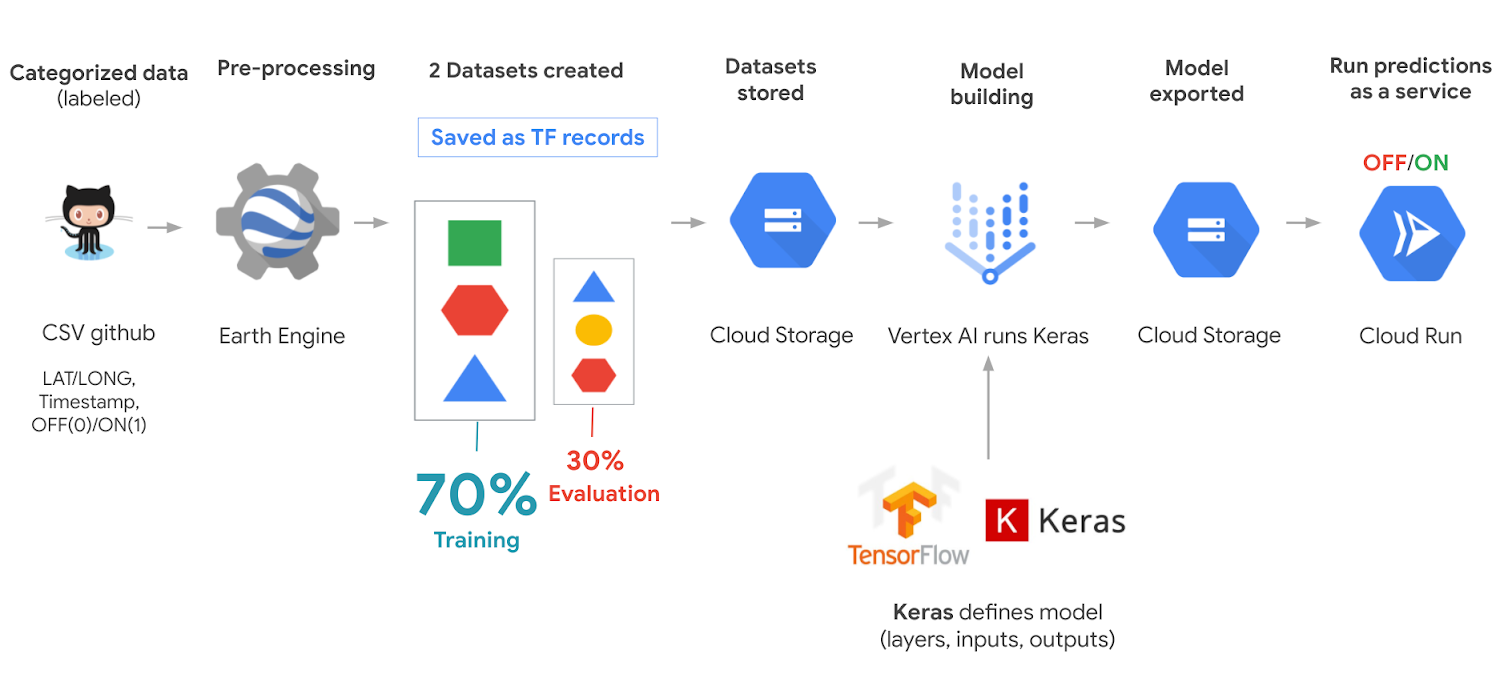
This is a high level view of the architecture.
Key concepts
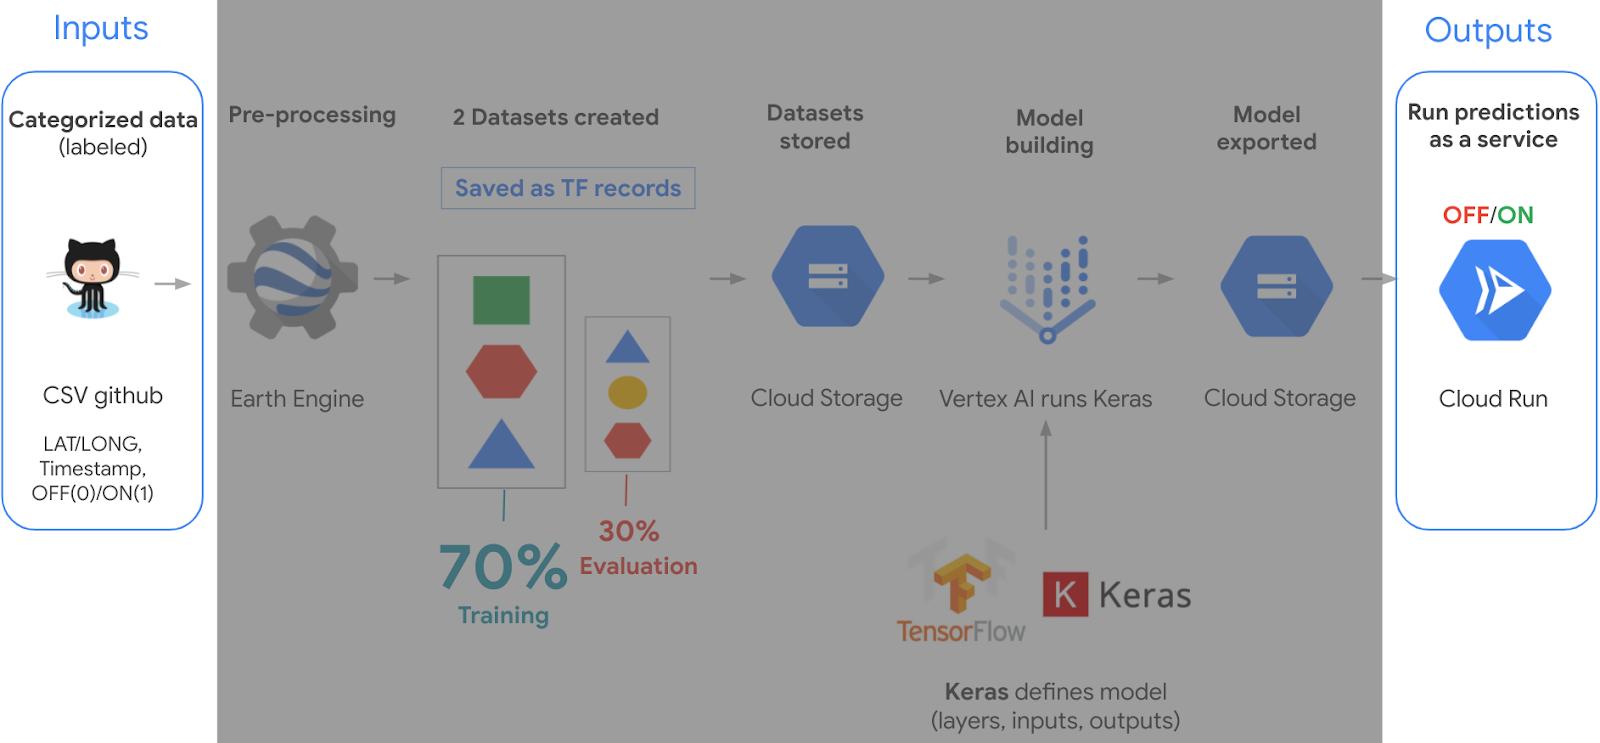
We first need to understand inputs & outputs.
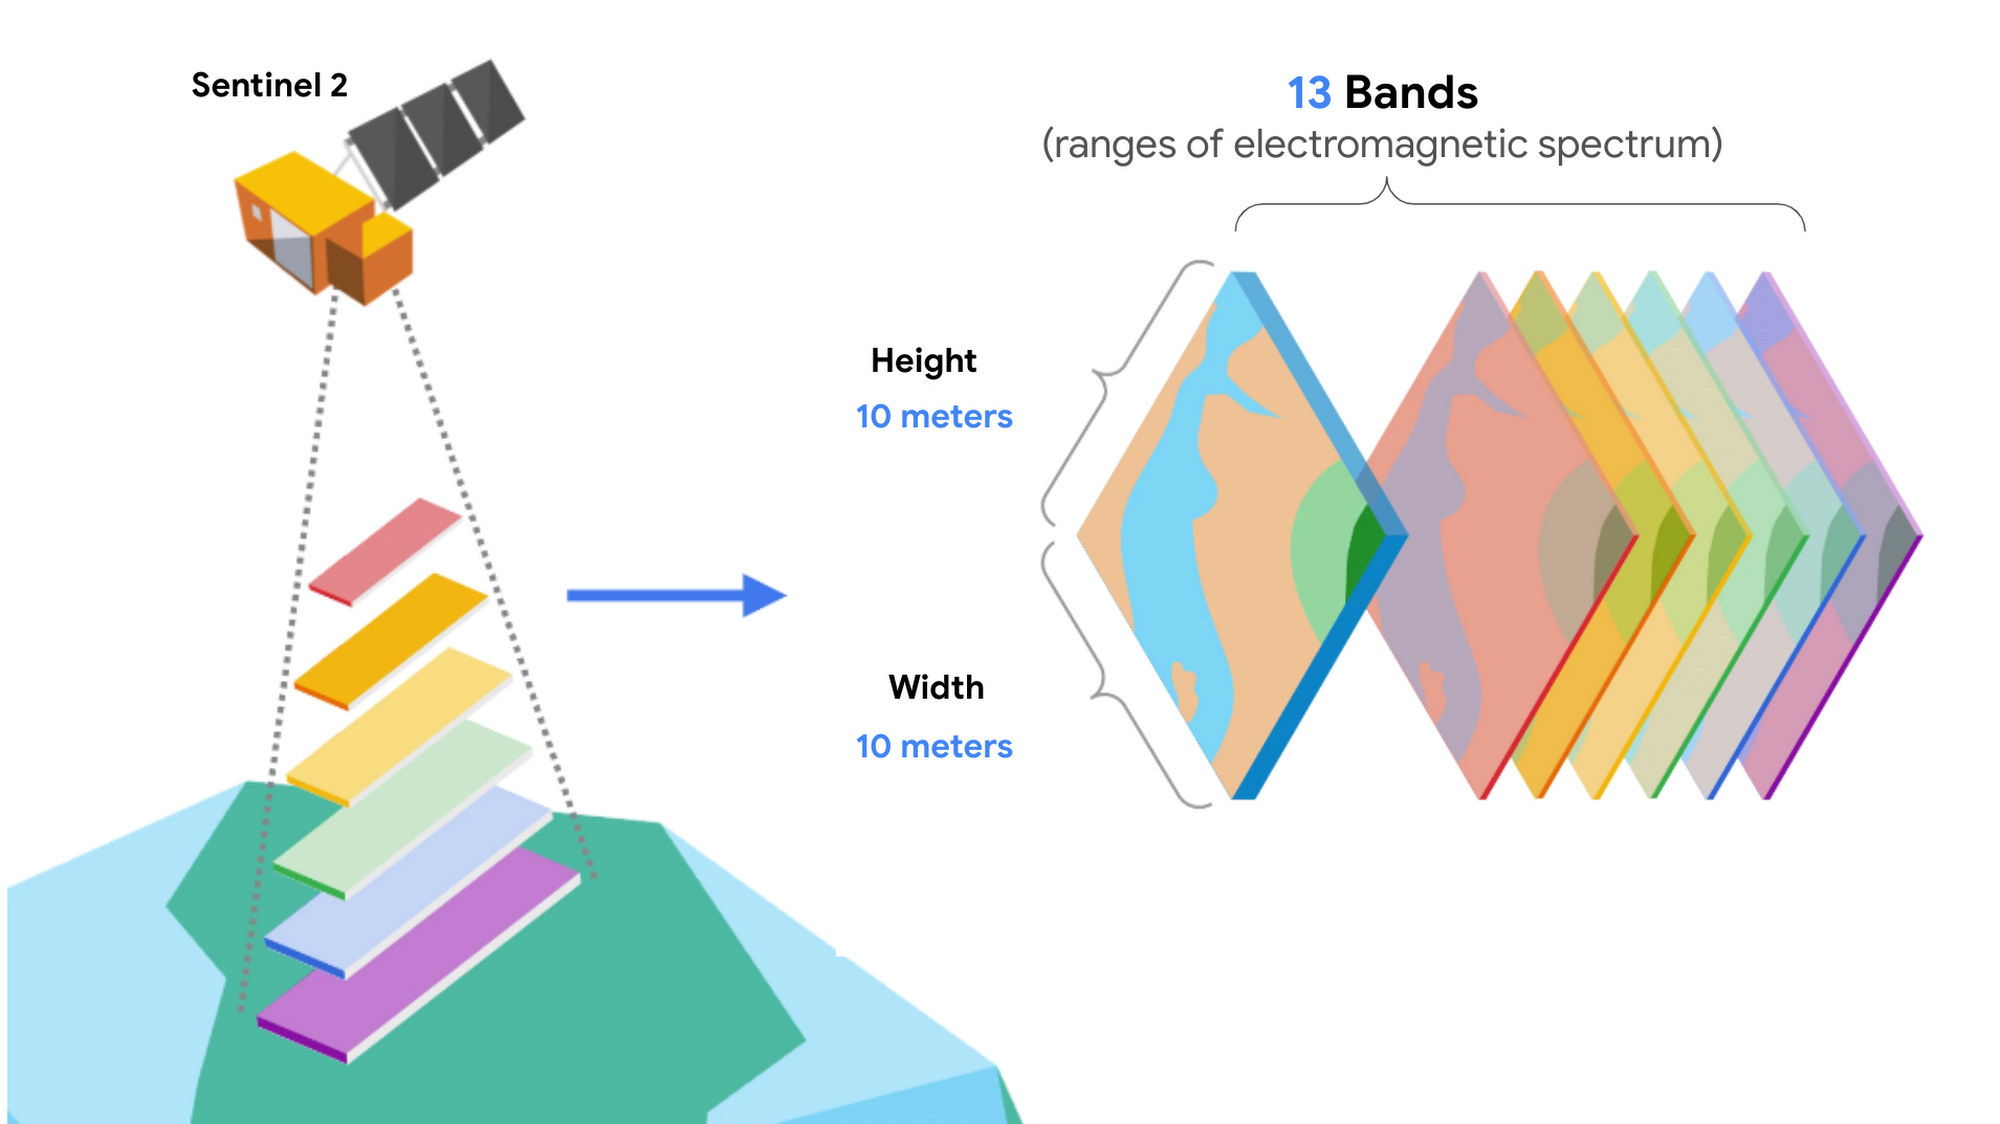
Our inputs are multispectral images of the entire planet that are taken every 10 days, since 2015 from Sentinel 2 (specifically Latitude: 83 degrees North to 56 degrees South). Bands are measurements from specific satellite instruments for different ranges of the electromagnetic spectrum. It’s similar to the 3 RGB (red, green, blue) channels for images.
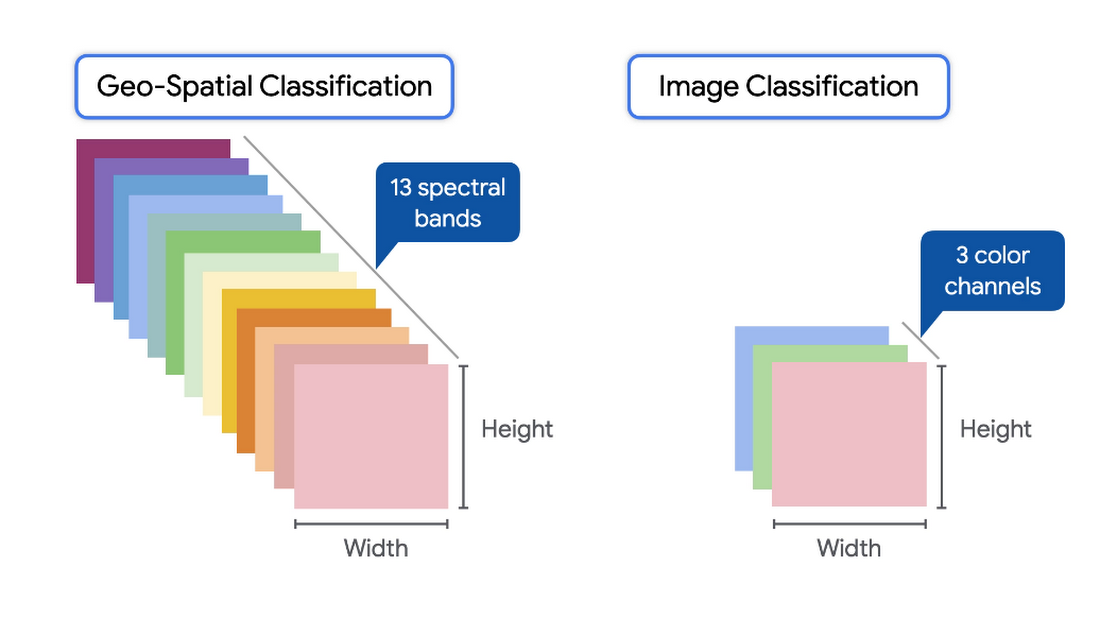
Every pixel in these images approximately covers a 10-meter by 10 meter area. When working with satellite data, each input image has the dimensions [width, height, # of bands].
As for outputs in our example, it’s a single number between 0 (Off) and 1 (On), representing the probability of that coal plant being ON.
Building the datasets
Next, let’s move on to the data we use to build our model. Climate TRACE went through the labor of love of labeling lat/lon locations of coal plants that correspond to Sentinel 2 images and shared it as a CSV file. It also includes whether a coal plant was on or off at different times.
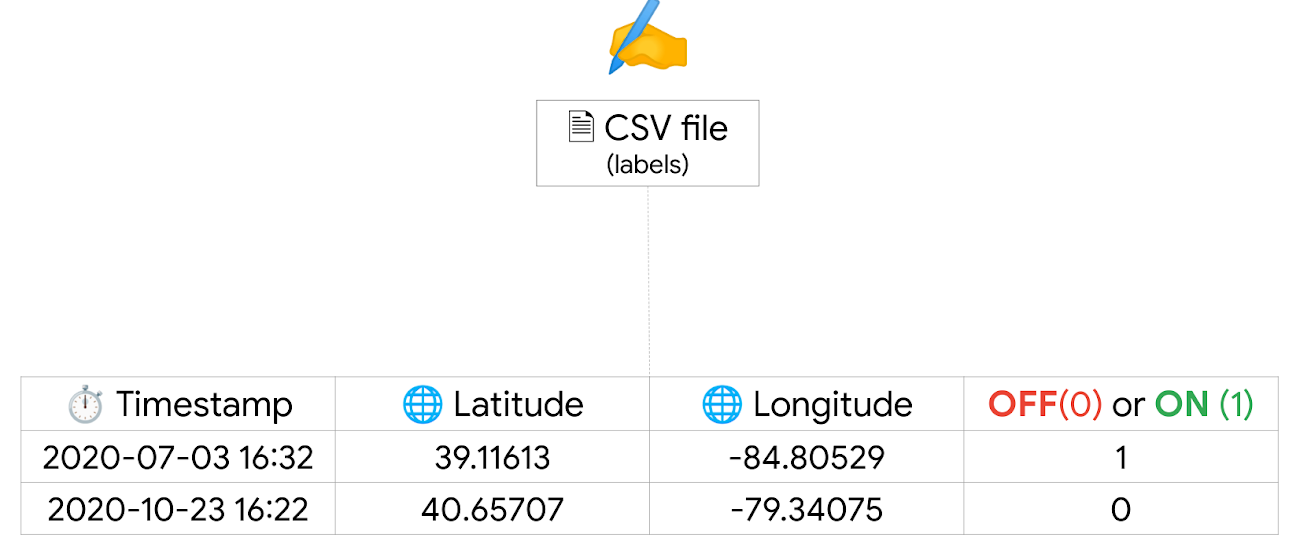
Next, we use Google Earth Engine to get the band values for a patch of pixels given their lat/long, and timestamp from each row of the CSV file. We basically view the band values as the data inputs, and the label ON/OFF as the answers.
From this, we randomly split this data into training and validation datasets and save them as TF records in Cloud Storage. For this case we split it into 70 percent training and 30 percent validation datasets (note, you can use 80/20 as well or other desired combinations, as long as the training dataset is larger than the validation).
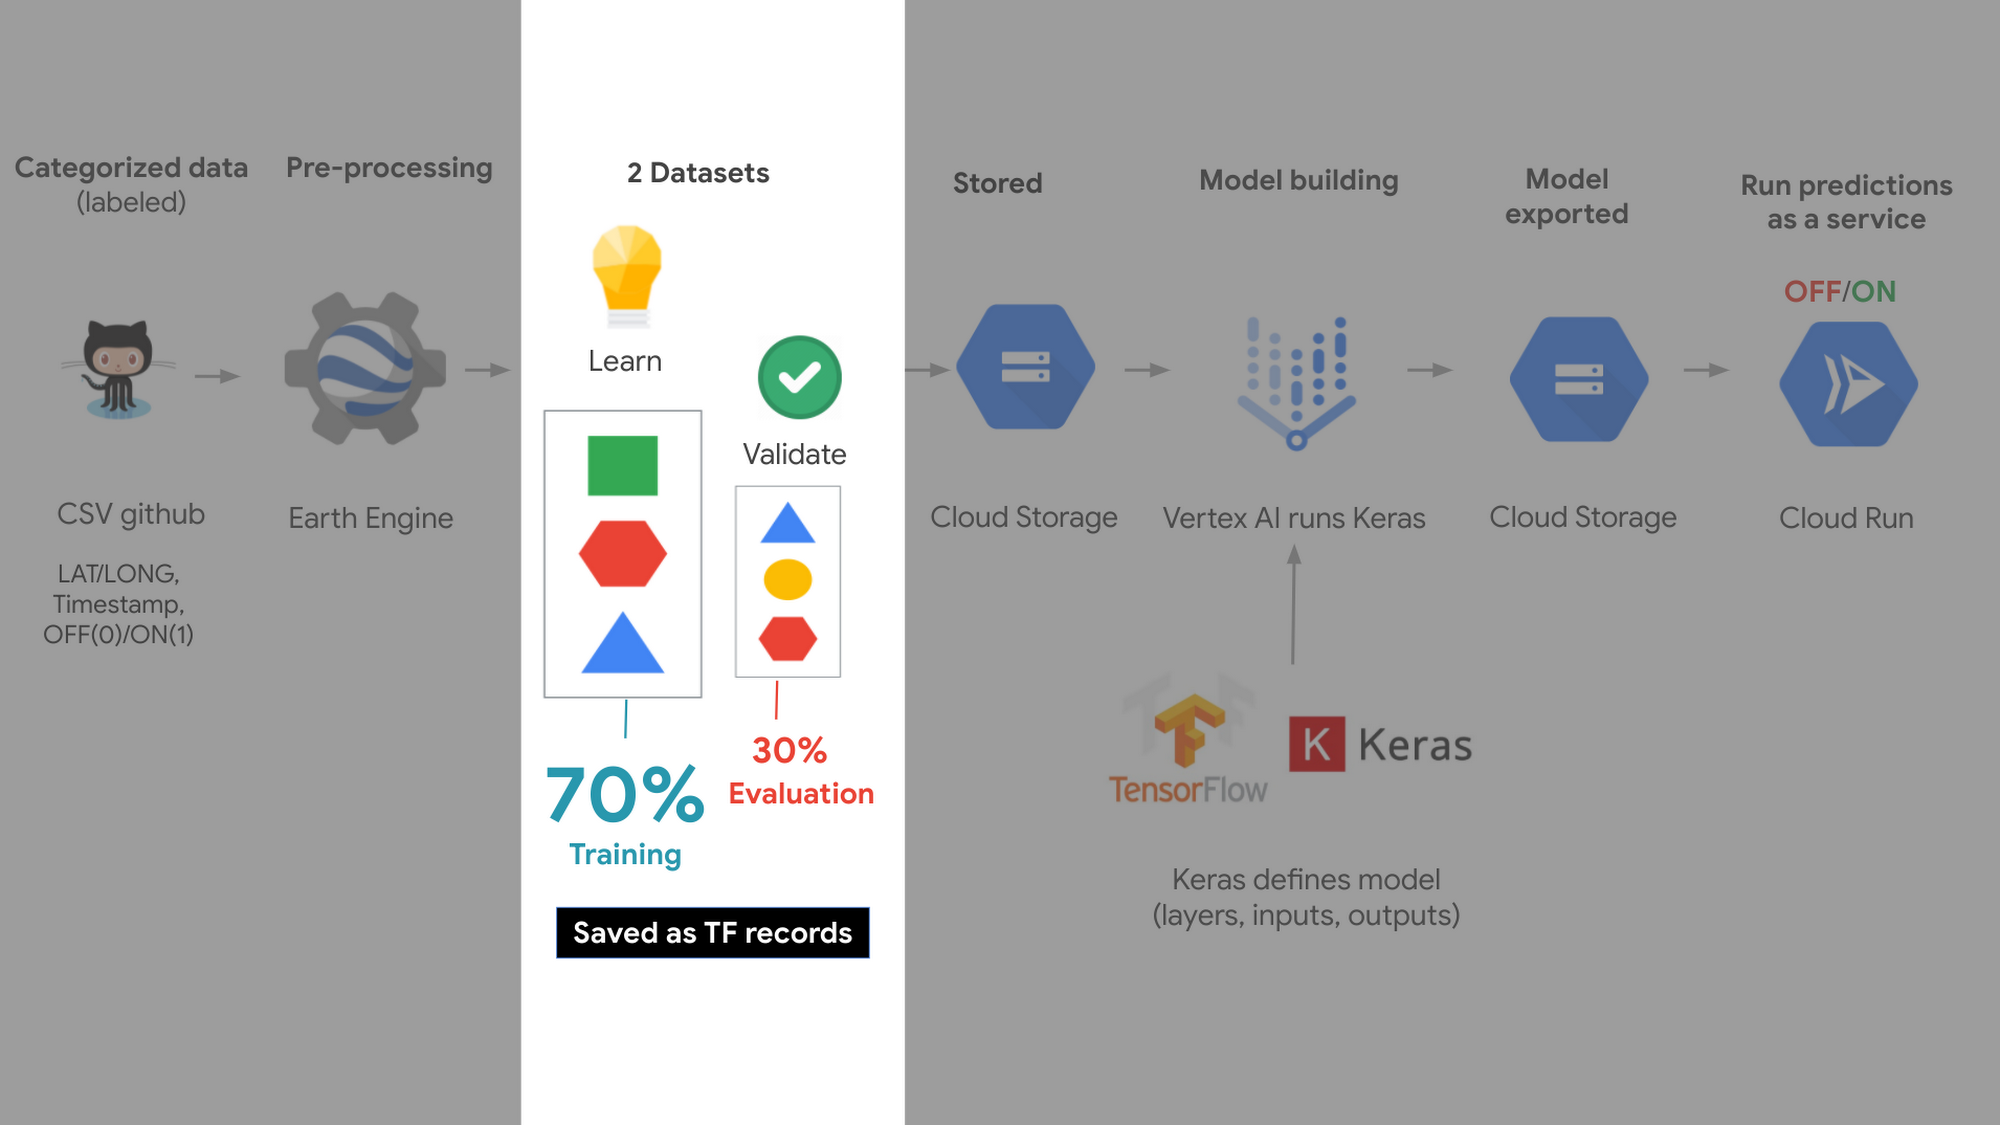
This means the model studies and learns from the training dataset, and the validation dataset is used like an exam, to make sure its learning to generalize to data it hasn’t seen before.
Creating a model
Next we use Vertex AI, Google’s machine learning platform to train and validate the model, using Tensorflow Keras. We specifically use a convolutional neural network, which is an ML technique that works well with image data; and receives a patch of pixels where the power plant is at its center. Each pixel in Sentinel 2 is approximately 10 meters, and so for this problem, we decided to use a padding of 16 pixels around the plant, making a consistent patch size of 33×33 pixels. The plant is at the center.
That means that our 33 by 33 patch is around 330 meters by 330 meters of coverage, and that the model returns the percent probability of whether it deems the plant is ON.
🛎️ Note: Vertex AI Training has a feature called autopackaging, which will build a custom Docker image based on your training code, push the image to Container Registry, and start a custom training job based on the image. This is a great option if you do not want to build your own image, or are not very familiar with Docker. The reason we did not use this lovely feature in our sample is because Colab notebooks at this time do not support Docker containers. For more information on autopackaging in Vertex AI training check out this tutorial.
Export model and run as a prediction service
Once we are happy with our model, it is stored into Cloud Storage. And in order to use that model to make predictions of any coal plant, we deploy it on Cloud Run and make it a predictions service.
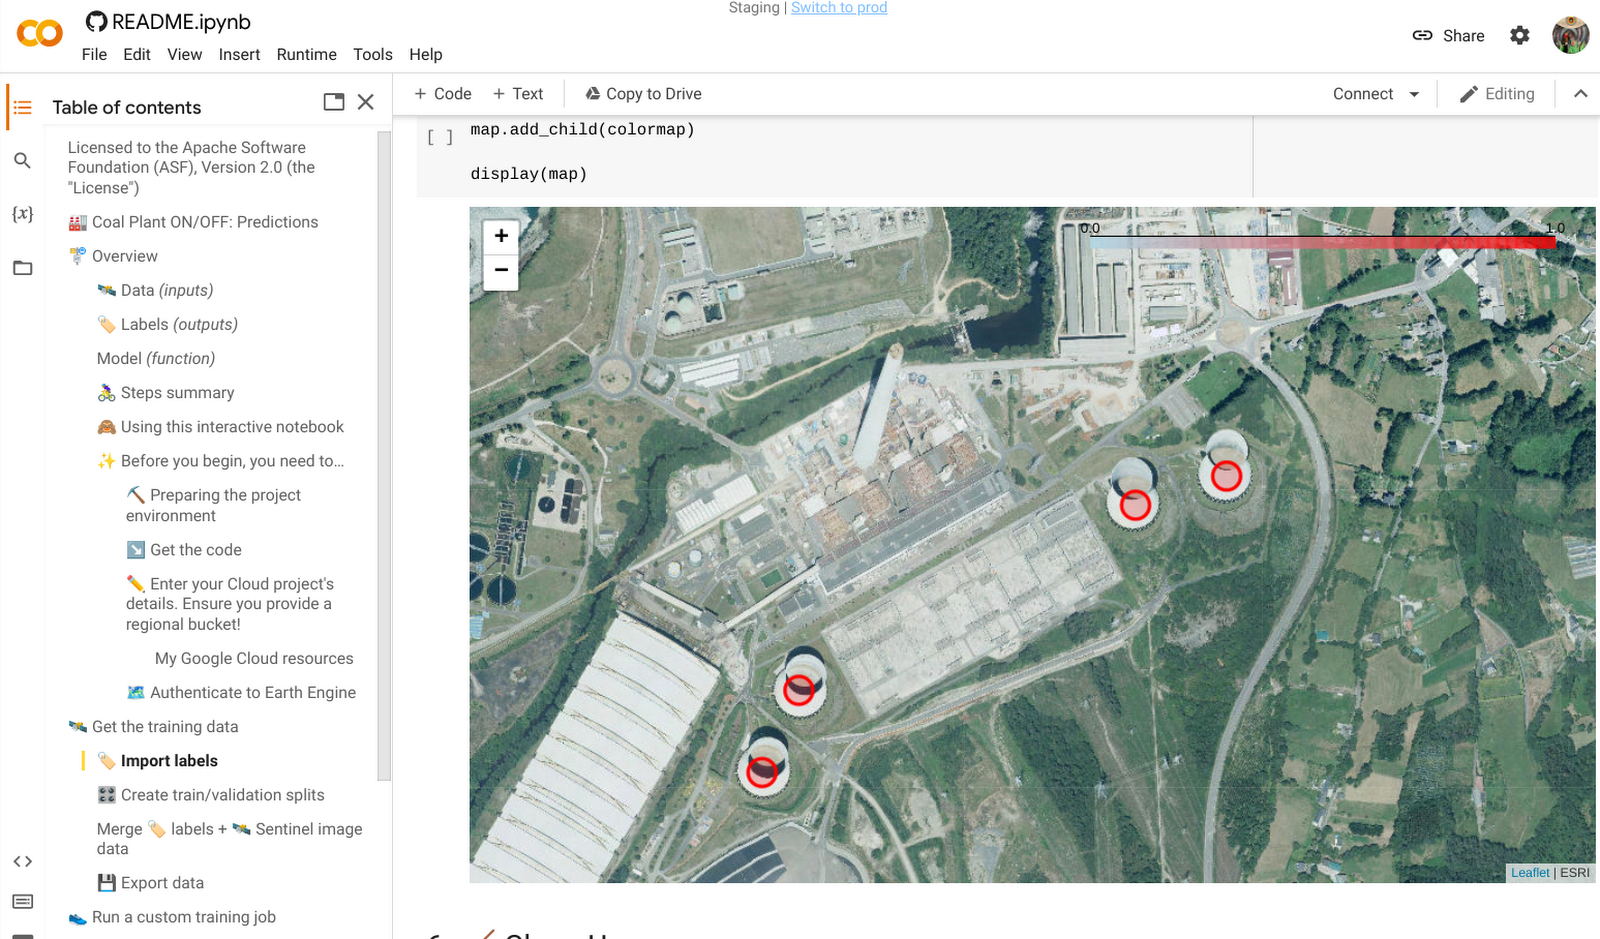
Since our sample code lives in a Colab notebook, we can also visualize the results of the predictions from Cloud Run in Colab by using a Python library called Folium.
Try it out
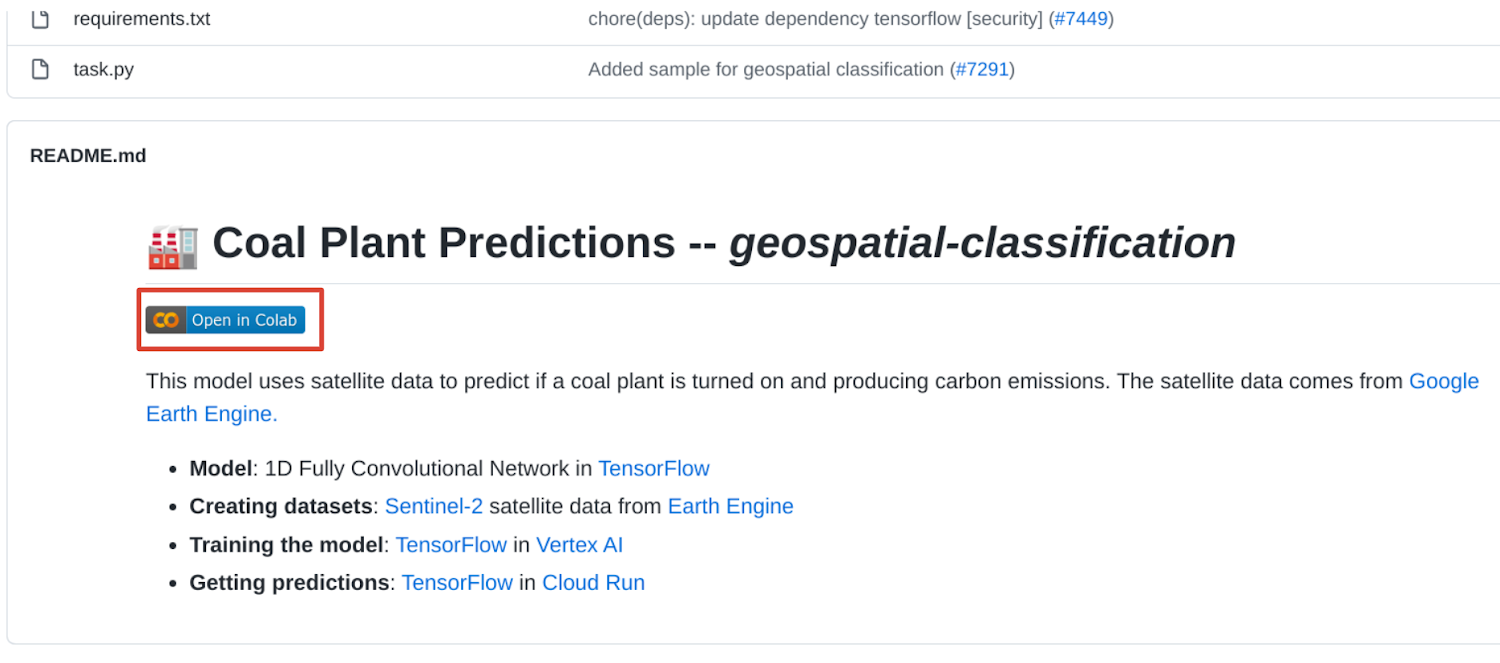
To access data on carbon pollution visit Climate TRACE’s free web app. However if you would like to build your own geo-classification model of coal plants, check out our code sample in a hosted notebook that we published on GitHub. It was created by our peer Nikita Namjoshi. It requires no prior knowledge and it contains all the code you need to train a model, run predictions, and visualize it on a map.
You must visit the notebook interface by simply scrolling to the bottom of the GitHub page and click “Open in Colab” or click this link directly. In this hosted notebook, you will click each “run” ▶️ icon to see its logic get processed for every section.
🛎️IMPORTANT: You can view the code without a Google Cloud project, however if you would like to run the code on Cloud resources (recommended) you will need to have a Google Cloud project with billing enabled and enter it in the notebook along with creating a uniquely named storage bucket. If you do not have one, here is a link to starting a free trial that contains $300 in funds (friendly reminder, the total cost to run this sample is less than $1 so you are covered by the trial). When finished running the notebook with your Cloud resources, we also recommend deleting the compute resources after if you will no longer be using them to avoid ongoing costs.
Price breakdown
The total cost to run this sample is around $1, here are the details by product:
- 🗺️ Google Earth Engine (dataset extraction of satellite images): Free to the public, just requires registering for an account.
- 👟 Vertex AI (training a model with a GPU): around $1
- 💻 Cloud Run (web service to host model and make predictions): Few cents covered by free tier.
- 🏭 Colab Notebook to visualize results on a map: Free to the public, just requires a Google Cloud project with billing enabled to run the code.
By Alexandrina Garcia-Verdin, Google Developer Advocate
Source Google Cloud
For enquiries, product placements, sponsorships, and collaborations, connect with us at [email protected]. We'd love to hear from you!
Our humans need coffee too! Your support is highly appreciated, thank you!