aster.cloud aster.cloud
  • /
  • Platforms
    • Public Cloud
    • On-Premise
    • Hybrid Cloud
    • Data
  • Architecture
    • Design
    • Solutions
    • Enterprise
  • Engineering
    • Automation
    • Software Engineering
    • Project Management
    • DevOps
  • Programming
    • Learning
  • Tools
  • About
  • /
  • Platforms
    • Public Cloud
    • On-Premise
    • Hybrid Cloud
    • Data
  • Architecture
    • Design
    • Solutions
    • Enterprise
  • Engineering
    • Automation
    • Software Engineering
    • Project Management
    • DevOps
  • Programming
    • Learning
  • Tools
  • About
aster.cloud aster.cloud
  • /
  • Platforms
    • Public Cloud
    • On-Premise
    • Hybrid Cloud
    • Data
  • Architecture
    • Design
    • Solutions
    • Enterprise
  • Engineering
    • Automation
    • Software Engineering
    • Project Management
    • DevOps
  • Programming
    • Learning
  • Tools
  • About
  • Data
  • Engineering
  • Tools

Prometheus — Easy In, Difficult Out

  • aster.cloud
  • February 1, 2023
  • 3 minute read

Prometheus has become the de facto standard for time series metrics for both Cloud Native and legacy environments. Many technologies in the CNCF Landscape already include a Prometheus metrics endpoint and there are metric exporters for numerous other technologies. Running Prometheus on Kubernetes is straightforward with Helm charts for the Operator or the community Kube Stack. For bare metal, most Linux distributions include Prometheus in their software repositories. Finally, Prometheus as a service is available on AWS, Azure, GCP, and others such as Grafana, Victoria Metrics, Logz, and OpsVerse.

With the minimal effort of a day, a Prometheus server can be up, running, and collecting data. However, as many soon find out this is but the first step of a very long and never-ending journey.


Partner with aster.cloud
for your next big idea.
Let us know here.


From our partners:

CITI.IO :: Business. Institutions. Society. Global Political Economy.
CYBERPOGO.COM :: For the Arts, Sciences, and Technology.
DADAHACKS.COM :: Parenting For The Rest Of Us.
ZEDISTA.COM :: Entertainment. Sports. Culture. Escape.
TAKUMAKU.COM :: For The Hearth And Home.
ASTER.CLOUD :: From The Cloud And Beyond.
LIWAIWAI.COM :: Intelligence, Inside and Outside.
GLOBALCLOUDPLATFORMS.COM :: For The World's Computing Needs.
FIREGULAMAN.COM :: For The Fire In The Belly Of The Coder.
ASTERCASTER.COM :: Supra Astra. Beyond The Stars.
BARTDAY.COM :: Prosperity For Everyone.

Value Out

Great, you’ve completed the first step and you have a Prometheus instance full of data and you’re feeling pretty pleased with yourself. Now you just need to get some actionable information out, Grafana is the dashboard tool of choice to pair with Prometheus. Creating a useful set of dashboards is a nontrivial and time-consuming task. First of all, you’ll have to learn PromQL, the Prometheus query language, and you’ll have to learn which are the important metrics for each of the technologies you’re observing.

After some considerable toil, you now have a rudimentary set of dashboards covering the essentials. It soon gets tedious constantly watching dashboards, it would be much better to receive an alert notification if anything goes out of bounds. Now you are required to learn the fine art of threshold balancing. Setting too low will flood you with many false positives, setting too high will not trigger until it’s too late. Even if you manage to get the balance just right, you still just receive a series of discreet alerts without any context or correlation. This makes it impossible to know which are important and which are the initial cause or which are the secondary symptoms. This incessant chatter soon leads to alert fatigue.

Read More  Know More, Spend Less: How GKE Cost Optimization Insights Help You Optimize Kubernetes

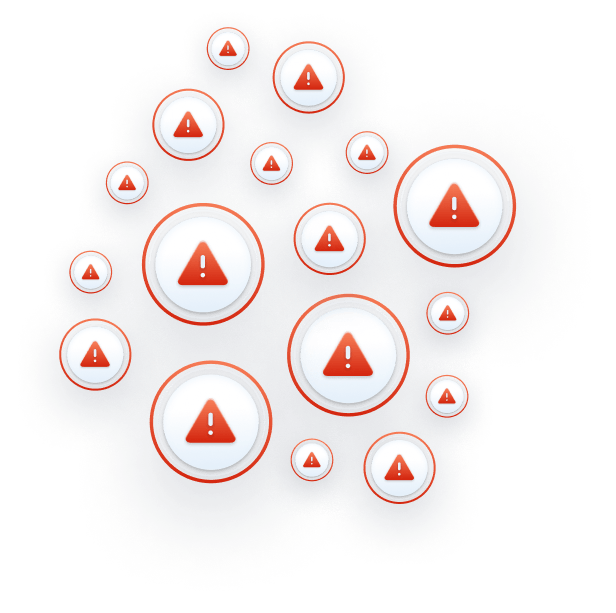
This is why most Prometheus implementations stall after the initial rollout. The failure to get real value out of all the collected data dampens the enthusiasm for implementing any more data collection.

If only there was an easy way to get value out of all that Prometheus data.

Second Step To Value

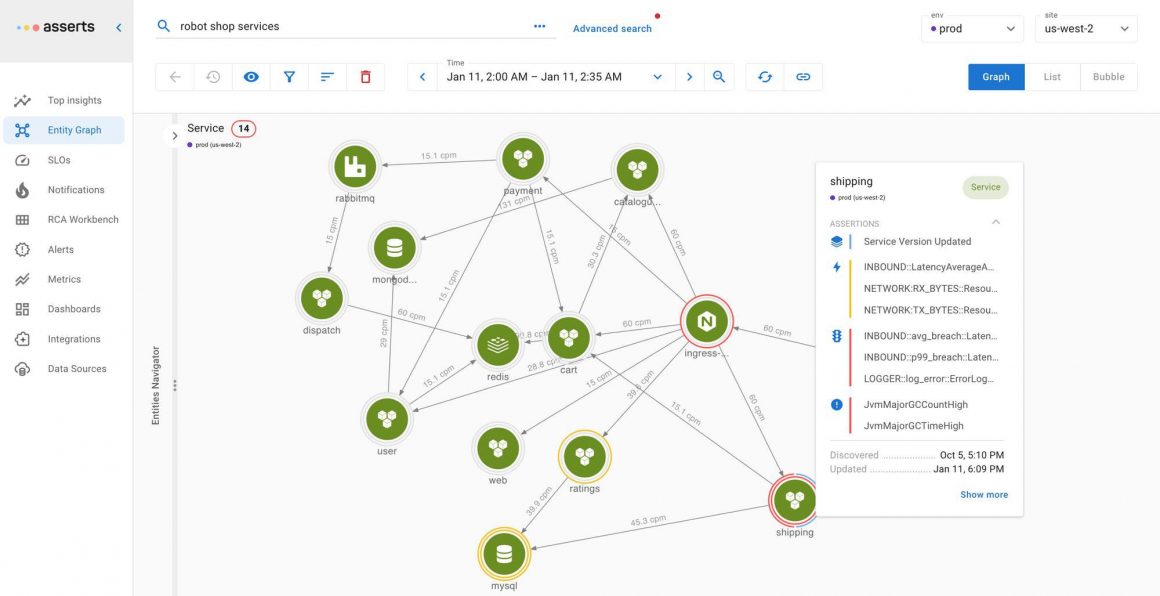
Asserts intelligently uses your existing Prometheus data to eliminate alert fatigue. Instead of a stream of unrelated alerts, Asserts provides contextual notifications with a direct link to the Root Cause Analysis Workbench, which automatically groups associated signals in one place, all the information you need is just a click away.

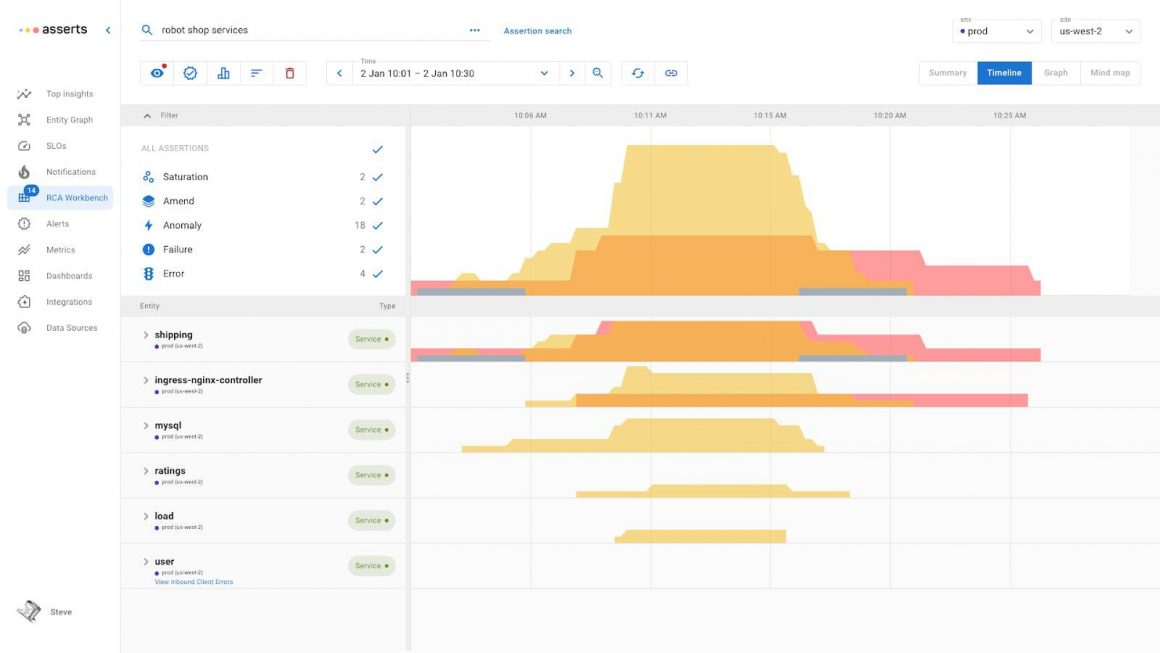
Asserts continually analyses the metric labels on your Prometheus data to build the Entity Graph tracking relationships over time. This enables Asserts to intelligently group alerts together, thus providing all the information you need for root cause analysis just a click away.

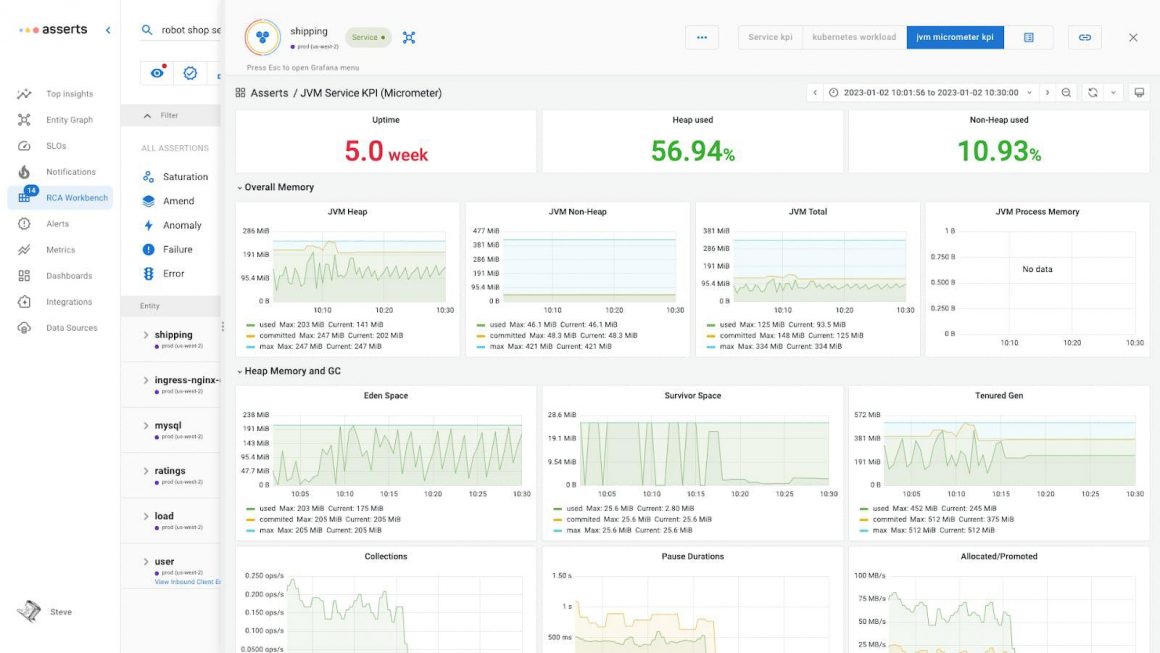
Asserts includes curated libraries for alert rules and Grafana dashboards, freeing you from the toil of creating and maintaining these resources; not to mention learning PromQL. If you already have some favorite dashboards, you can import them into Asserts and continue to use them. The alert rule library can also be easily edited to fine-tune to your exact requirements.

Asserts integrates with your existing log aggregation and tracing tools providing deep linking with context. Go straight from Asserts to log or trace analytics with the query and time range prepopulated. All the information you need is just a click away.

Path To SRE Nirvana

With the extra layer of automation and intelligence that Asserts provides on top of your existing Prometheus data, you’ll soon be getting real value from an asset you already have. However, this is only just the beginning of value realization. Now that you can effortlessly manage all your Prometheus data and eliminate alert fatigue, there’s no reason not to add more metric data. Many technologies provide a Prometheus metrics endpoint or there are numerous exporters available. These can be simply added without any code changes, significantly increasing the Observability coverage of your applications.

Read More  Edge Computing—A Paradigm Shift That Goes Beyond Hybrid Cloud

To achieve SRE Nirvana with complete visibility into your applications and the maximum value from your Prometheus investment, the Prometheus agent is added to the application code. This will provide deep metrics for the service runtime (Java, Go, Python, NodeJS, …) along with RED (Rate, Errors, Duration) metrics for each endpoint. With full metric coverage, application environments can be managed by setting Service Level Objectives (SLO) against application functionality. You will now have a smug sense of satisfaction that you have achieved Nirvana and have a reference implementation of the SRE Handbook.

Maximize the value of your Prometheus environment with a free trial of Asserts today.

Also published here.

By: Asserts
Source: Hackernoon


For enquiries, product placements, sponsorships, and collaborations, connect with us at [email protected]. We'd love to hear from you!

Our humans need coffee too! Your support is highly appreciated, thank you!

aster.cloud

Related Topics
  • Hackernoon
  • Kubernetes
  • Prometheus
You May Also Like
Data center
View Post
  • Data
  • Public Cloud

Data Sovereignty in Spain. It’s Not Just About the Law, It’s About Efficiency

  • June 3, 2026
View Post
  • Data
  • Platforms
  • Technology

Scaling cloud and AI: Microsoft Azure’s commitment to Europe’s digital future

  • May 11, 2026
View Post
  • Data

Streamline read scalability with Cloud SQL autoscaling read pools

  • March 23, 2026
View Post
  • Data
  • Platforms
  • Public Cloud

PayPal’s historically large data migration is the foundation for its gen AI innovation

  • March 4, 2026
View Post
  • Technology
  • Tools

IBM Launches Enterprise Advantage Service to Help Businesses Scale Agentic AI

  • January 19, 2026
View Post
  • Data
  • Technology

3 obstacles to agentic AI adoption and how to overcome them

  • December 22, 2025
Points, Lines and a Question
View Post
  • Architecture
  • Design
  • Engineering
  • People

What Is The Point In Making Points?

  • November 26, 2025
View Post
  • Engineering
  • Software Engineering

Development gets better with Age

  • October 9, 2025

Stay Connected!
LATEST
  • digital-nomad-freelancer-worker-2151205464 1
    One paperwork problem – Get your Digital Nomad Visa employment documents fast from UK, EU or Singapore
    • June 16, 2026
  • 2
    Samsung Art Store Brings Art Basel to Homes Worldwide With New Curated Collection
    • June 15, 2026
  • 3
    You Do Not Need to Invest in the IPO of SpaceX, Anthropic, and OpenAI
    • June 10, 2026
  • 4
    The consequences of relying on AI for accurate news
    • June 10, 2026
  • 5
    Connecting AI agents with unstructured data using Google Cloud Storage MCP Servers
    • June 10, 2026
  • 6
    WWDC26: Apple unveils next generation of Apple Intelligence, Siri AI, powerful parental controls, and an expansive set of software improvements
    • June 8, 2026
  • 7
    IBM and Google Cloud Announce Strategic Partnership to Scale AI with Human Expertise and AI‑Powered Delivery
    • June 4, 2026
  • Data center 8
    Data Sovereignty in Spain. It’s Not Just About the Law, It’s About Efficiency
    • June 3, 2026
  • 9
    Ink vs Pixels. What you miss versus what you are actually missing.
    • June 1, 2026
  • 10
    Banks race to patch new cyber vulnerabilities, and other cybersecurity news
    • May 25, 2026
about
Hello World!

We are aster.cloud. We’re created by programmers for programmers.

Our site aims to provide guides, programming tips, reviews, and interesting materials for tech people and those who want to learn in general.

We would like to hear from you.

If you have any feedback, enquiries, or sponsorship request, kindly reach out to us at:

[email protected]
Most Popular
  • pope-leo-xiv-cq5dam-1500.844 1
    Pope Leo XIV to Publish First Encyclical on Artificial Intelligence and Human Dignity on 25 May
    • May 22, 2026
  • 2
    Portfolio to Clients, and is Strengthened by Ongoing Project Glasswing Work
    • May 20, 2026
  • reMarkable Paper Pure 3
    Everything The reMarkable Paper Pure Actually Does
    • May 14, 2026
  • 4
    Scaling cloud and AI: Microsoft Azure’s commitment to Europe’s digital future
    • May 11, 2026
  • Anthropic Institute 5
    Introducing The Anthropic Institute
    • March 11, 2026
  • /
  • Technology
  • Tools
  • About
  • Contact Us

Input your search keywords and press Enter.