aster.cloud aster.cloud
  • /
  • Platforms
    • Public Cloud
    • On-Premise
    • Hybrid Cloud
    • Data
  • Architecture
    • Design
    • Solutions
    • Enterprise
  • Engineering
    • Automation
    • Software Engineering
    • Project Management
    • DevOps
  • Programming
    • Learning
  • Tools
  • About
  • /
  • Platforms
    • Public Cloud
    • On-Premise
    • Hybrid Cloud
    • Data
  • Architecture
    • Design
    • Solutions
    • Enterprise
  • Engineering
    • Automation
    • Software Engineering
    • Project Management
    • DevOps
  • Programming
    • Learning
  • Tools
  • About
aster.cloud aster.cloud
  • /
  • Platforms
    • Public Cloud
    • On-Premise
    • Hybrid Cloud
    • Data
  • Architecture
    • Design
    • Solutions
    • Enterprise
  • Engineering
    • Automation
    • Software Engineering
    • Project Management
    • DevOps
  • Programming
    • Learning
  • Tools
  • About
  • Learning

What is a data visualisation?! A predictable pile of digits?

  • John Francis
  • October 7, 2023
  • 2 minute read

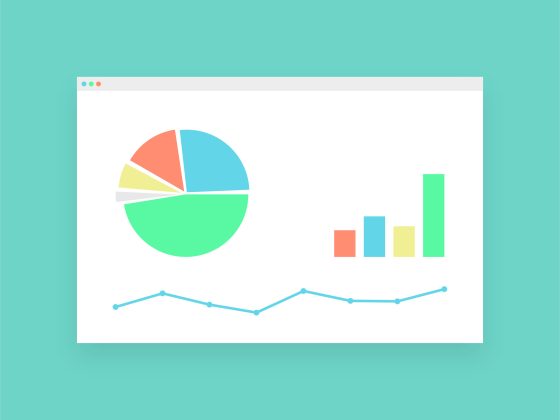
What comes into your mind when you hear or see “Data Visualisation”. It’s probably chart or graphics. That is correct, but that is not all it is.

“Data visualization is the representation of data through use of common graphics, such as charts, plots, infographics, and even animations. These visual displays of information communicate complex data relationships and data-driven insights in a way that is easy to understand.”

IBM

From it’s definition you can already see it’s objective. To make data easier to understand. That is in it’s essence, the purpose of why we make data visualisation. Here have some key points to consider when making a data visualistion


Partner with aster.cloud
for your next big idea.
Let us know here.


From our partners:

CITI.IO :: Business. Institutions. Society. Global Political Economy.
CYBERPOGO.COM :: For the Arts, Sciences, and Technology.
DADAHACKS.COM :: Parenting For The Rest Of Us.
ZEDISTA.COM :: Entertainment. Sports. Culture. Escape.
TAKUMAKU.COM :: For The Hearth And Home.
ASTER.CLOUD :: From The Cloud And Beyond.
LIWAIWAI.COM :: Intelligence, Inside and Outside.
GLOBALCLOUDPLATFORMS.COM :: For The World's Computing Needs.
FIREGULAMAN.COM :: For The Fire In The Belly Of The Coder.
ASTERCASTER.COM :: Supra Astra. Beyond The Stars.
BARTDAY.COM :: Prosperity For Everyone.

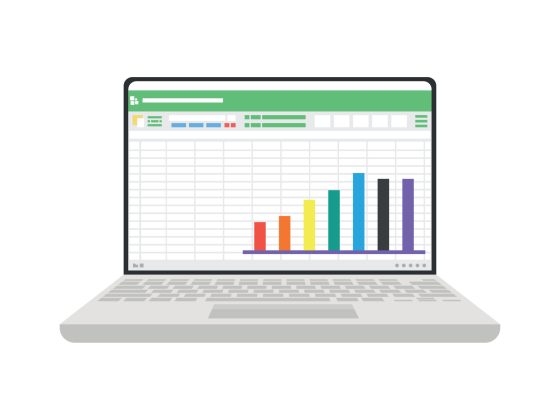
What is the nature of your data?

The nature of the data is important. It usually is a collection of records taken within a period of time. It could be a daily transaction or sales of a grocery, the number of times you have eaten in a specific restaurant, or one of the most common sources and use of data is stocks. By default even without creating a graphics your data will already show something. Now it is up to you to make use of it.

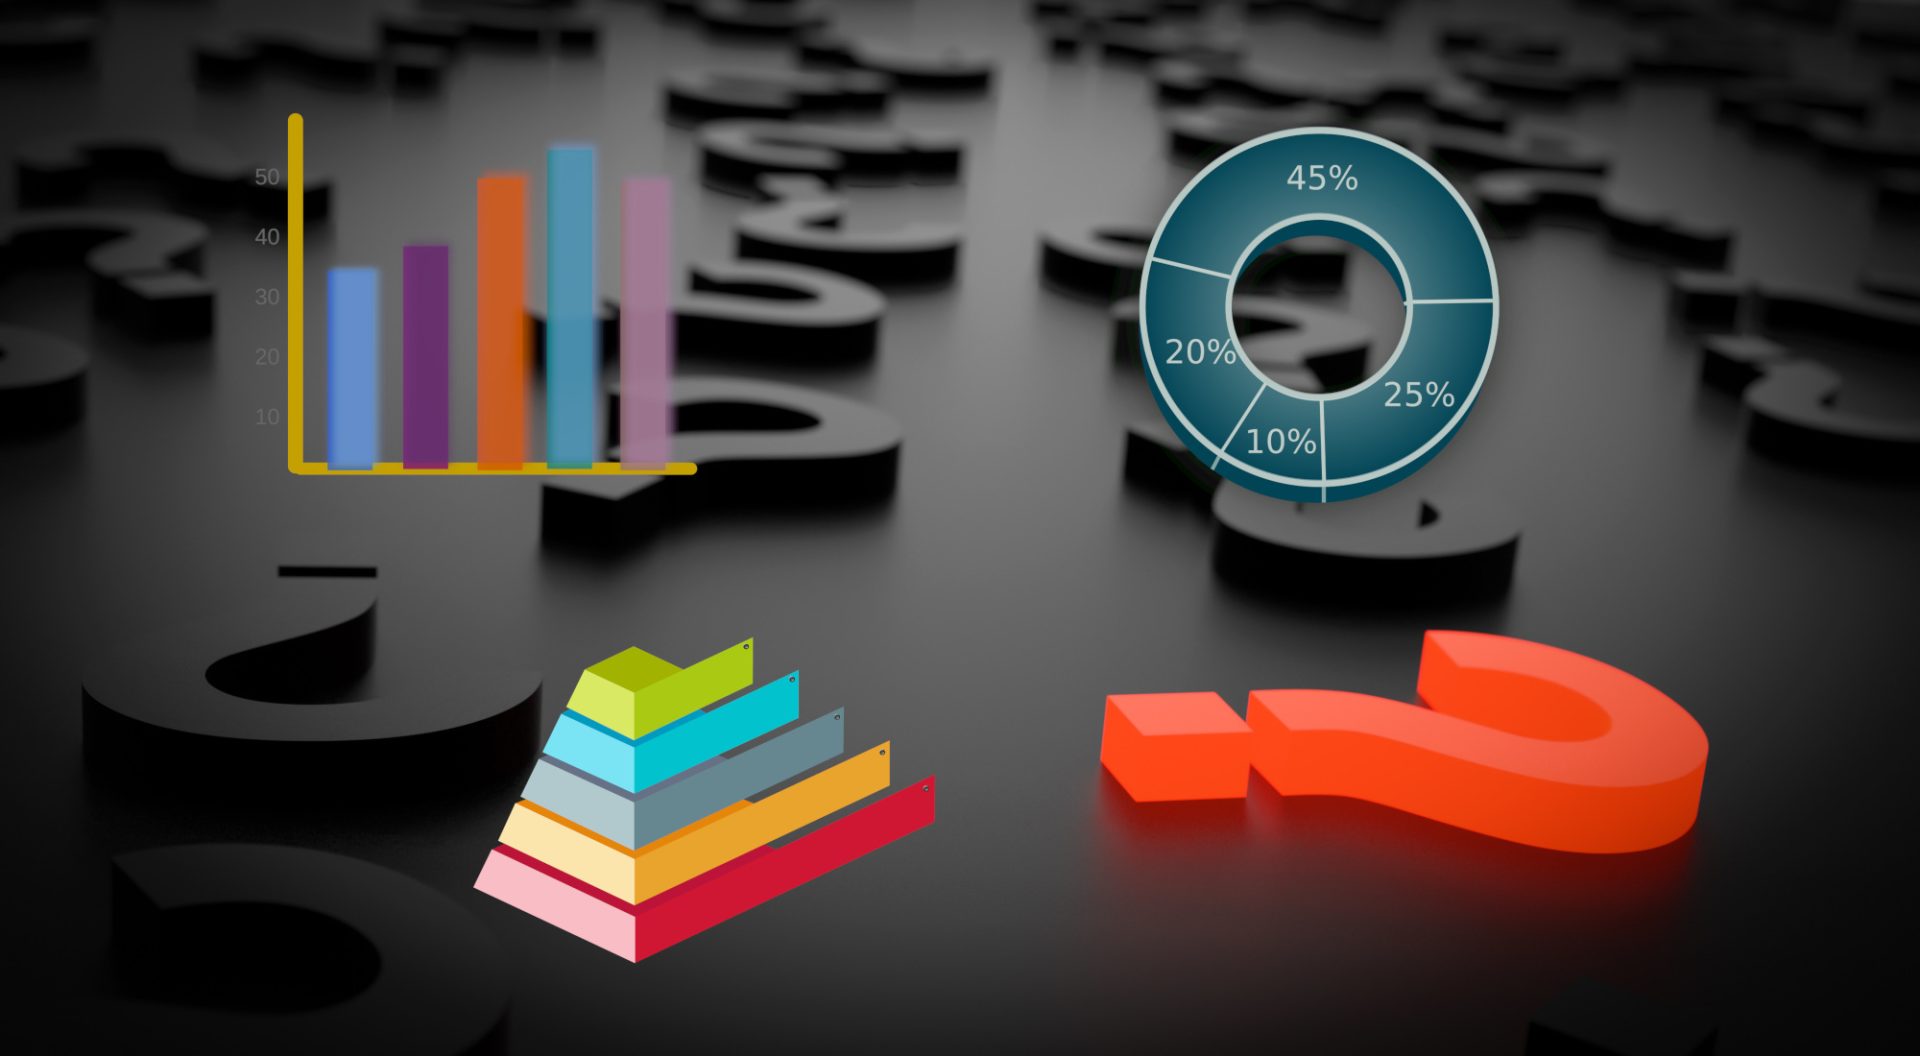
What you want the audience to understand?

Now that you have a source of data, you need to identify what your audience need to realise after seeing your visualisation. One thing to make it easier is that your design should make it easier and faster to understand your point when comparing it when they are just given the data plainly. If they did not understood the purpose of the graphical representation then it can be considered a failure and should reconsider a redesign.

Read More  Resources to Take Your Charts From Bland to Beautiful

Showing it to someone and asking for opinion is a good start. It might be hard at first to do this yourself, as there may be some bias. But in the future, you should be able to switch to a different perspective or even a persona when looking at your own design. Somewhere along the line “If I were this type of person who does not know anything about this line of work and see this, what would I realise or understand from it?”

What you really want to say?

If you have created a visualisation that makes people understood the visusalisation, you can safely say that you have created something to look at too. Your audience might be everyone specially when publish publicly. But it could also be a team in your company.

With this in mind, have you conveyed what your objective is for this graphics. It’s also possible that it can be misunderstood to look at. An example is that you have created a chart that shows the sales of your product. Instead of showing that the sales have been decreasing due to lack of marketing, it was blamed on the engineering or production team.

Remember that data can be misinterpreted. It can even be manipulated. What you convey depends on how you represent the data.


For enquiries, product placements, sponsorships, and collaborations, connect with us at [email protected]. We'd love to hear from you!

Our humans need coffee too! Your support is highly appreciated, thank you!

John Francis

Related Topics
  • Data
  • Data visualisation
  • Design
  • Graphics
You May Also Like
Getting things done makes her feel amazing
View Post
  • Computing
  • Data
  • Featured
  • Learning
  • Tech
  • Technology

Nurturing Minds in the Digital Revolution

  • April 25, 2025
Cloud platforms among the clouds
View Post
  • Computing
  • Learning
  • Public Cloud

Best Cloud Platforms Offering Free Trials for Cloud Mastery

  • December 23, 2024
Crab
View Post
  • Gears
  • Learning
  • Software

The Best Friends for a Rustacean. Top Books in Learning Rust.

  • August 25, 2024
View Post
  • Engineering
  • Learning

ABC’s of the Linux Nano Editor.

  • October 10, 2023
View Post
  • Data
  • Learning

Resources to Take Your Charts From Bland to Beautiful

  • September 6, 2023
Dog with glasses using a tablet
View Post
  • Learning

More Than Math – The Must-Have Non-Technical Skills for Data Pros

  • August 18, 2023
Laptop and spreadsheet
View Post
  • Learning

Simple Things That Are Good To Know In Google Spreadsheets

  • August 13, 2023
People using on laptop
View Post
  • Learning

Increase Productivity With These Simple Tips

  • August 12, 2023

Stay Connected!
LATEST
  • digital-nomad-freelancer-worker-2151205464 1
    One paperwork problem – Get your Digital Nomad Visa employment documents fast from UK, EU or Singapore
    • June 16, 2026
  • 2
    Samsung Art Store Brings Art Basel to Homes Worldwide With New Curated Collection
    • June 15, 2026
  • 3
    You Do Not Need to Invest in the IPO of SpaceX, Anthropic, and OpenAI
    • June 10, 2026
  • 4
    The consequences of relying on AI for accurate news
    • June 10, 2026
  • 5
    Connecting AI agents with unstructured data using Google Cloud Storage MCP Servers
    • June 10, 2026
  • 6
    WWDC26: Apple unveils next generation of Apple Intelligence, Siri AI, powerful parental controls, and an expansive set of software improvements
    • June 8, 2026
  • 7
    IBM and Google Cloud Announce Strategic Partnership to Scale AI with Human Expertise and AI‑Powered Delivery
    • June 4, 2026
  • Data center 8
    Data Sovereignty in Spain. It’s Not Just About the Law, It’s About Efficiency
    • June 3, 2026
  • 9
    Ink vs Pixels. What you miss versus what you are actually missing.
    • June 1, 2026
  • 10
    Banks race to patch new cyber vulnerabilities, and other cybersecurity news
    • May 25, 2026
about
Hello World!

We are aster.cloud. We’re created by programmers for programmers.

Our site aims to provide guides, programming tips, reviews, and interesting materials for tech people and those who want to learn in general.

We would like to hear from you.

If you have any feedback, enquiries, or sponsorship request, kindly reach out to us at:

[email protected]
Most Popular
  • pope-leo-xiv-cq5dam-1500.844 1
    Pope Leo XIV to Publish First Encyclical on Artificial Intelligence and Human Dignity on 25 May
    • May 22, 2026
  • 2
    Portfolio to Clients, and is Strengthened by Ongoing Project Glasswing Work
    • May 20, 2026
  • reMarkable Paper Pure 3
    Everything The reMarkable Paper Pure Actually Does
    • May 14, 2026
  • 4
    Scaling cloud and AI: Microsoft Azure’s commitment to Europe’s digital future
    • May 11, 2026
  • Anthropic Institute 5
    Introducing The Anthropic Institute
    • March 11, 2026
  • /
  • Technology
  • Tools
  • About
  • Contact Us

Input your search keywords and press Enter.